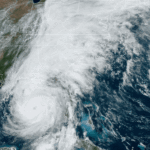
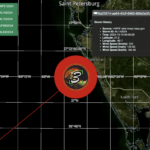
This 3D simulation of the Earth provides a dynamic and interactive map displaying global storm data representing real-time. It allows users to visualize the tracks and intensities of storms around the world, and not just hurricanes. The storms are color-coded based on their wind speed, offering an intuitive visualization of current weather events. An AI processes data, machine learning, and artificial intelligence to refresh our data plus our hourly product which is available through an email list. The code for this application utilizes git at hurricane-net.
Click on a storm button and click the storm icons to get details. Scroll or pinch to zoom on the map. Alternatively, you can also access it through the URL nfc.ai/map
Created using Cesium.js with data provided by NOAA, NASA, and our open sourced algorithms.


