


Visualising the intensity and progression of hurricanes on digital platforms has seen an impressive upgrade. A diligent researcher has created a set of distinctive icons that represent the categories of the Saffir-Simpson Hurricane Wind Scale. They are hosted on a GitHub repository called hurricane-net and can be found here.
These icons, interestingly, are not just static images. They are imbued with Generative AI tech called Midjourney to create dynamic backgrounds. Midjourney was chosen over other generative models like Stable Diffusion and Dall E due to its superior performance in generating diverse yet cohesive imagery.
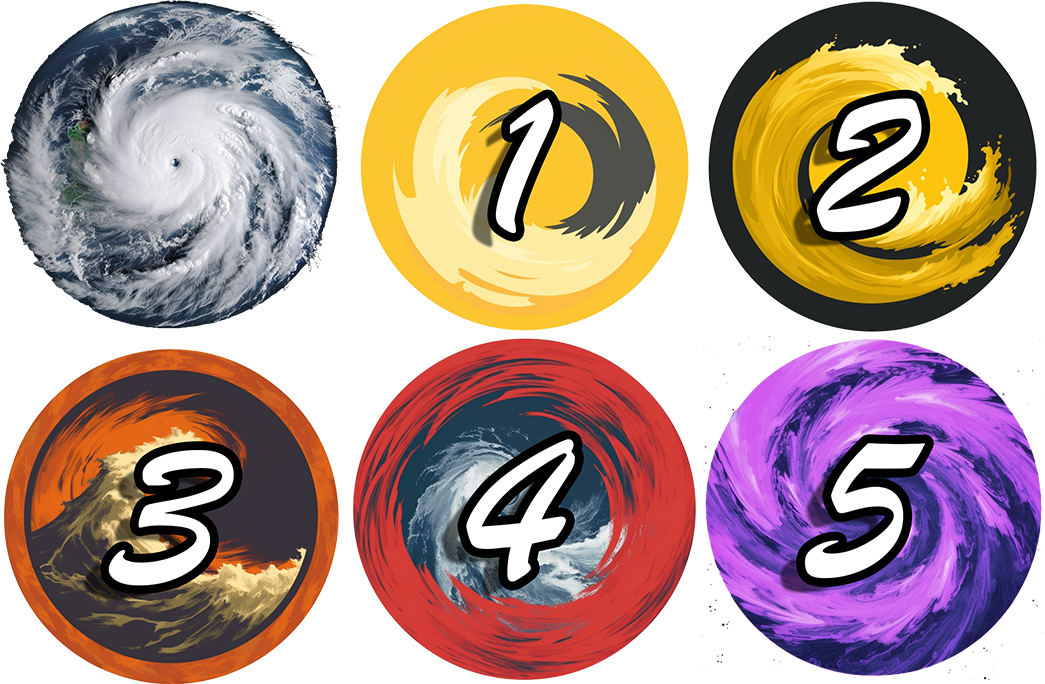
The choice of the Saffir-Simpson scale as a basis for these icons was driven by its color scheme, which transitions from yellow to red as the severity increases from category 1 through 4. Category 5, signifying the most potent storms, is represented by the color purple. The researcher ingeniously crafted the backgrounds of the icons to echo these color scales, resulting in an immediate visual understanding of a storm’s intensity.
These icons serve a greater purpose than just aesthetic enhancement. They play a vital role in the fluids.ai application, where they help visualize live global tropical storms. The variability of the storm’s intensity over time, which can often be dramatic, can now be visualized effortlessly, enhancing the user experience in emergency scenarios.
The icons’ innovative design allows users to gain a quick understanding of the storm’s severity as it approaches the shore, adding a new dimension to how we perceive and react to such natural disasters.
Moreover, the source code is readily available to developers who wish to contribute or adapt these icons for their projects, exemplifying the spirit of open-source and collaborative problem-solving.
Indeed, the intersection of art, technology, and meteorology, as demonstrated in this project, offers a fresh perspective on disaster visualization, making information more digestible and impactful for all.
For those interested in getting a firsthand glimpse of this innovative blend of meteorology and Generative AI, the researcher has shared a series of web links. The ‘no cat’ link showcases an icon sans any category, offering a foundational visualization of a storm that can be accessed here. Following this, as the intensity escalates from ‘cat 1’ to ‘cat 5’, the visual vibrancy and gravity of the situation can be discerned clearly. The icons for the respective categories can be seen through these links: cat 1, cat 2, cat 3, cat 4, and the most intense, cat 5. Each link offers a window into the unique visual representation, embodying the power and scale of tropical storms.