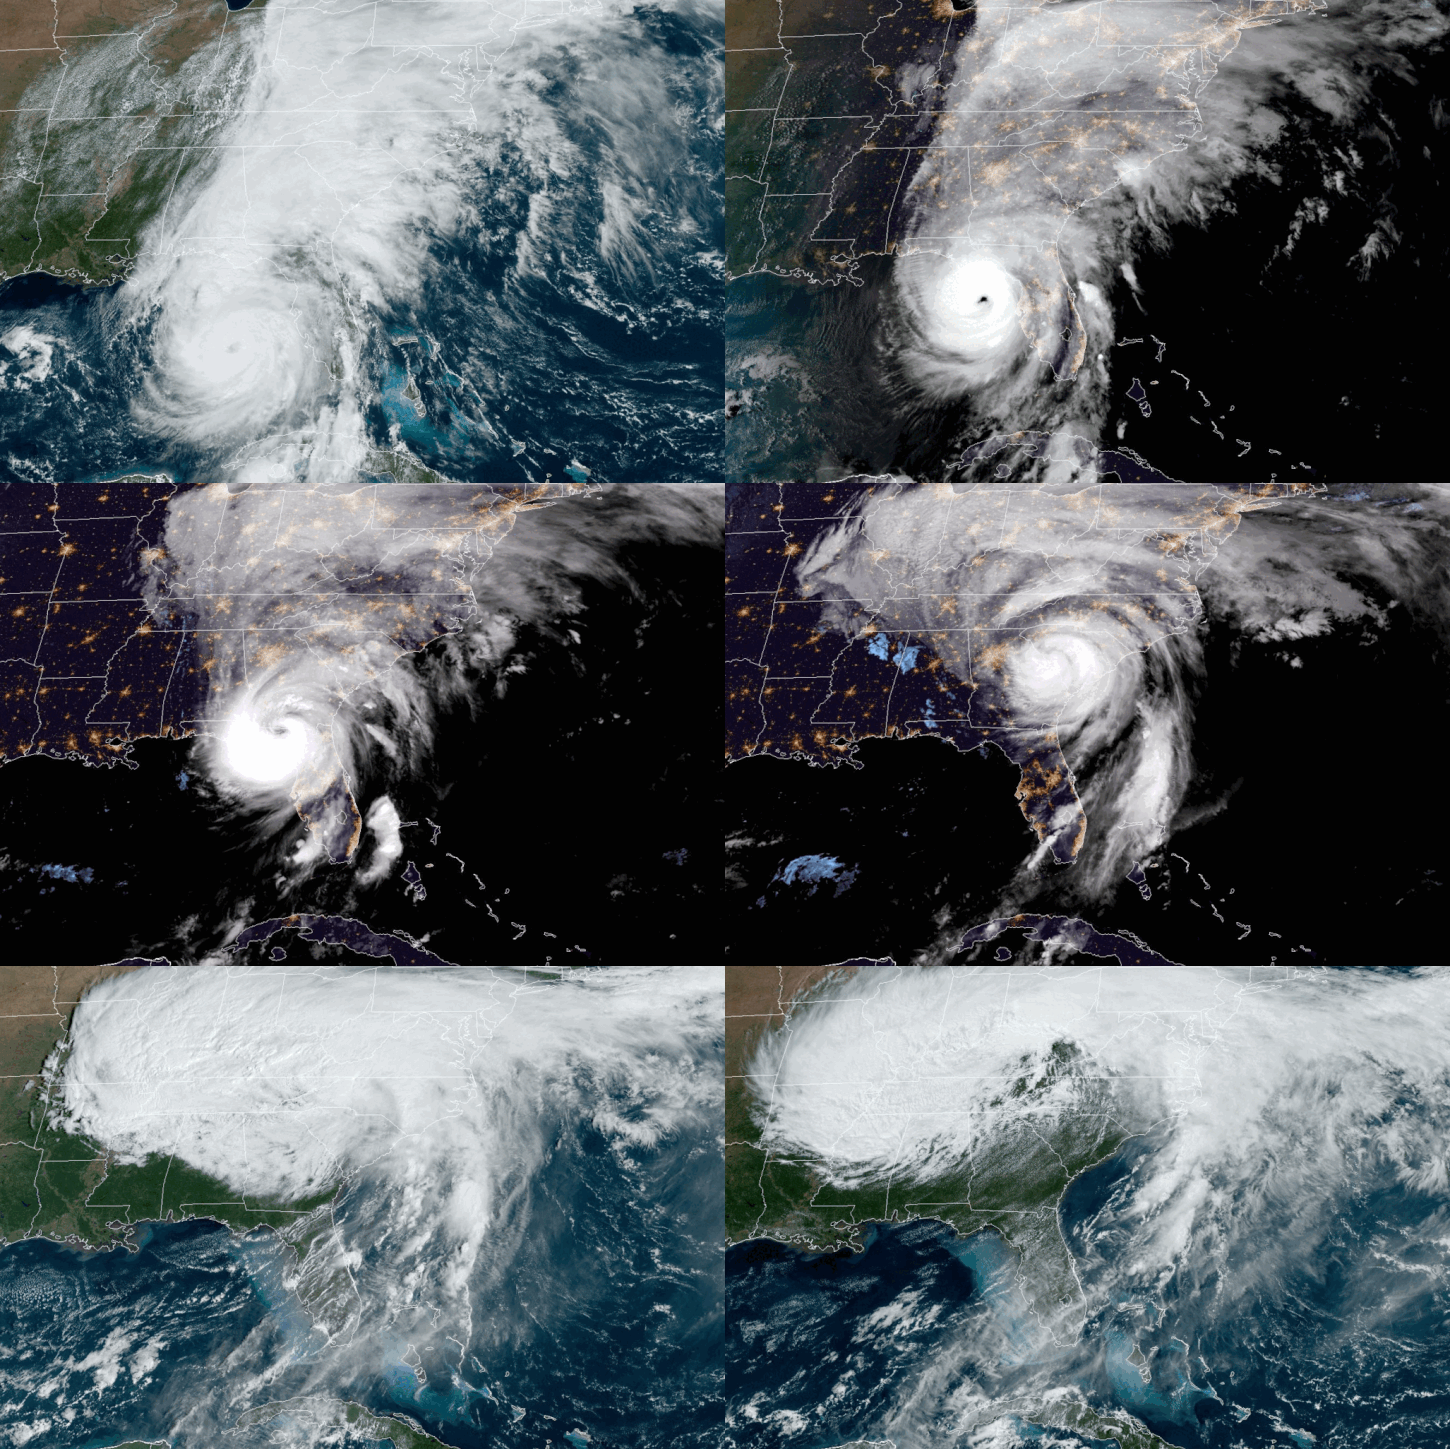
We are excited to present our interactive global storm tracking map, available at https://fluids.ai/map/. This platform is built to provide real-time tracking of global storms, including Hurricane Milton, a Category 5 storm that recently made landfall as a Category 3 storm near Florida’s west coast.
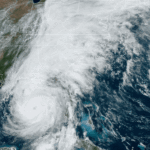
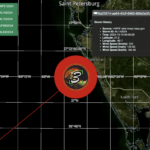
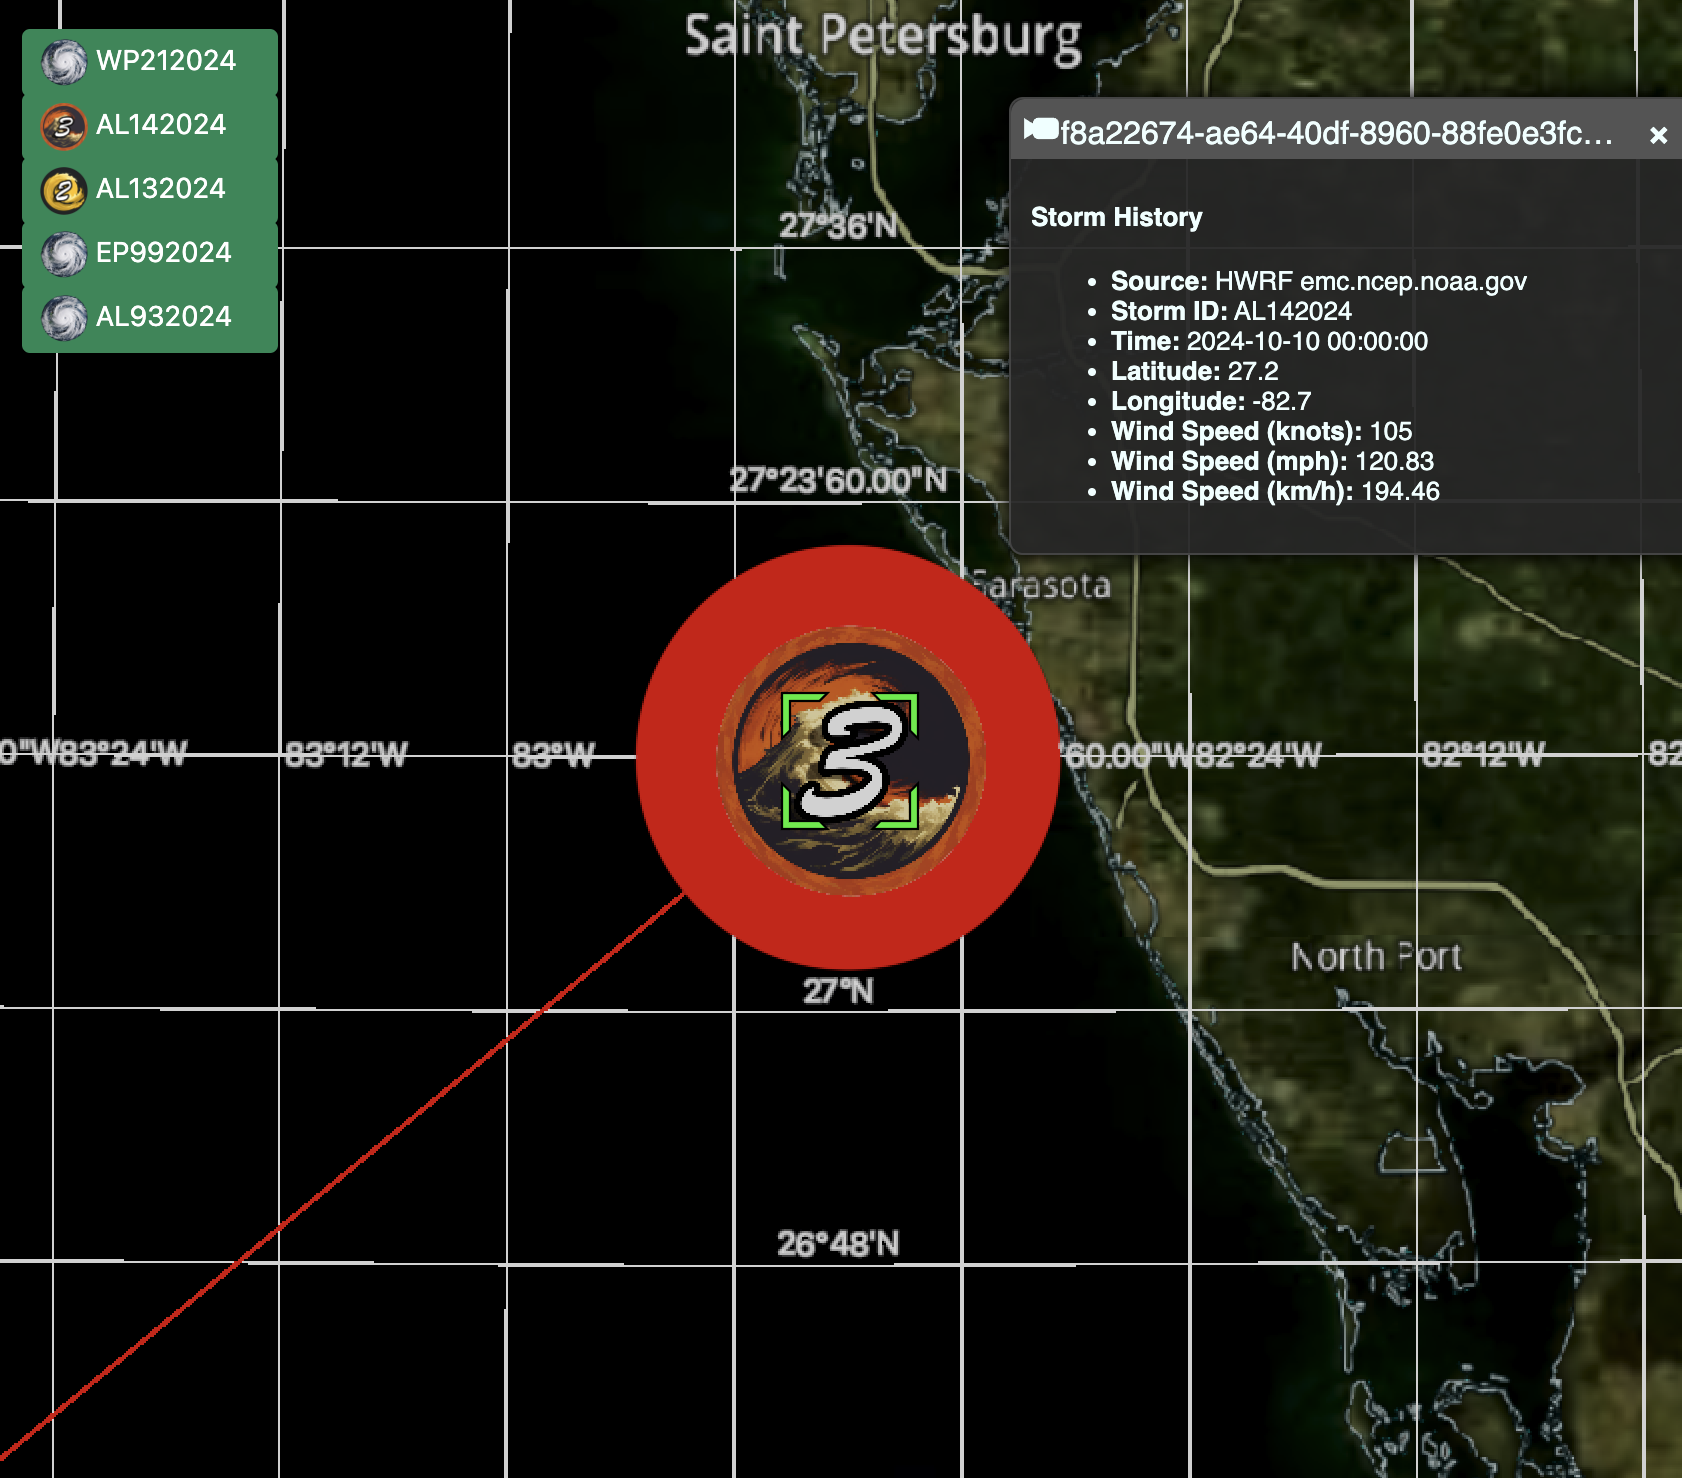
Using advanced satellite imagery and data feeds, users can monitor hurricanes and storms, visualizing their intensification in real-time. As seen in the image of Hurricane Milton’s landfall, the system provides critical data like wind speeds, storm paths, and storm histories at any given point during the storm’s progression.
Key Features:
- Real-time global storm data: Track active storms with live updates.
- Color-coded storm intensities: Visualize storm categories from tropical storms to Category 5 hurricanes.
- Detailed storm history: Access key data such as wind speeds, storm coordinates, and landfall locations.
Our platform serves as a crucial resource for scientists, weather enthusiasts, and anyone interested in monitoring global storm patterns.
🌩️ Explore the map at https://fluids.ai/map/ and experience the future of hurricane tracking.
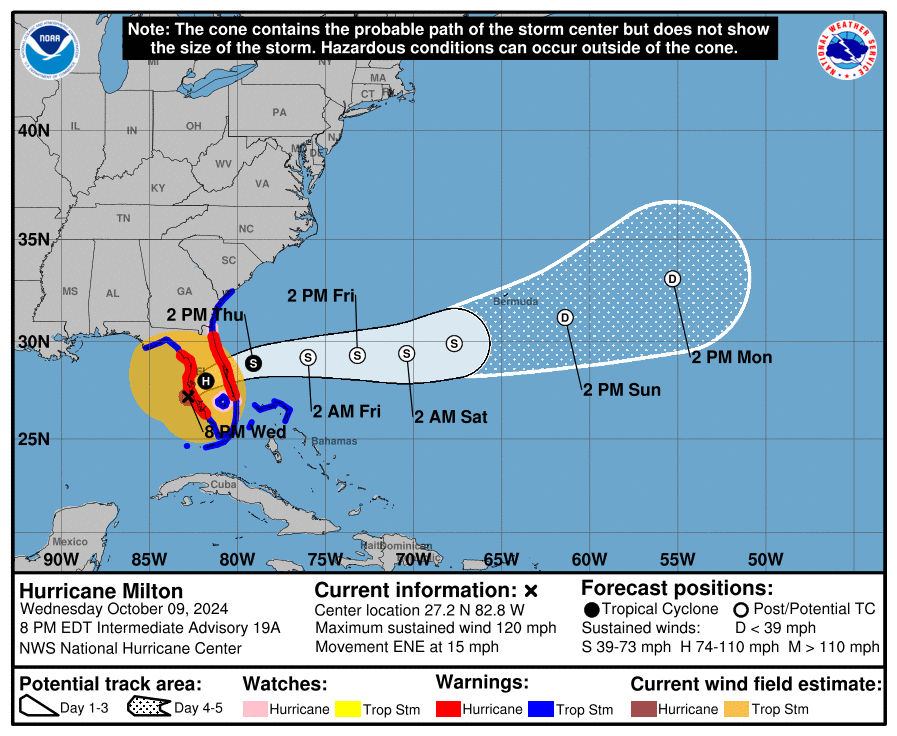
Please reference this source for official data and find the Coastal Watches/Warnings and Forecast Cone for Storm Center graphic below.
