The 2026 hurricane season forecast leverages the IBTrACS database and the new hurricane-net Python package to quantify the timing of major storms worldwide. By integrating data from the North Atlantic through the Eastern and Australian basin, we reveal a peak in Category 3+ activity. This update refines the 2025 findings with perspective.
Reproducible Code
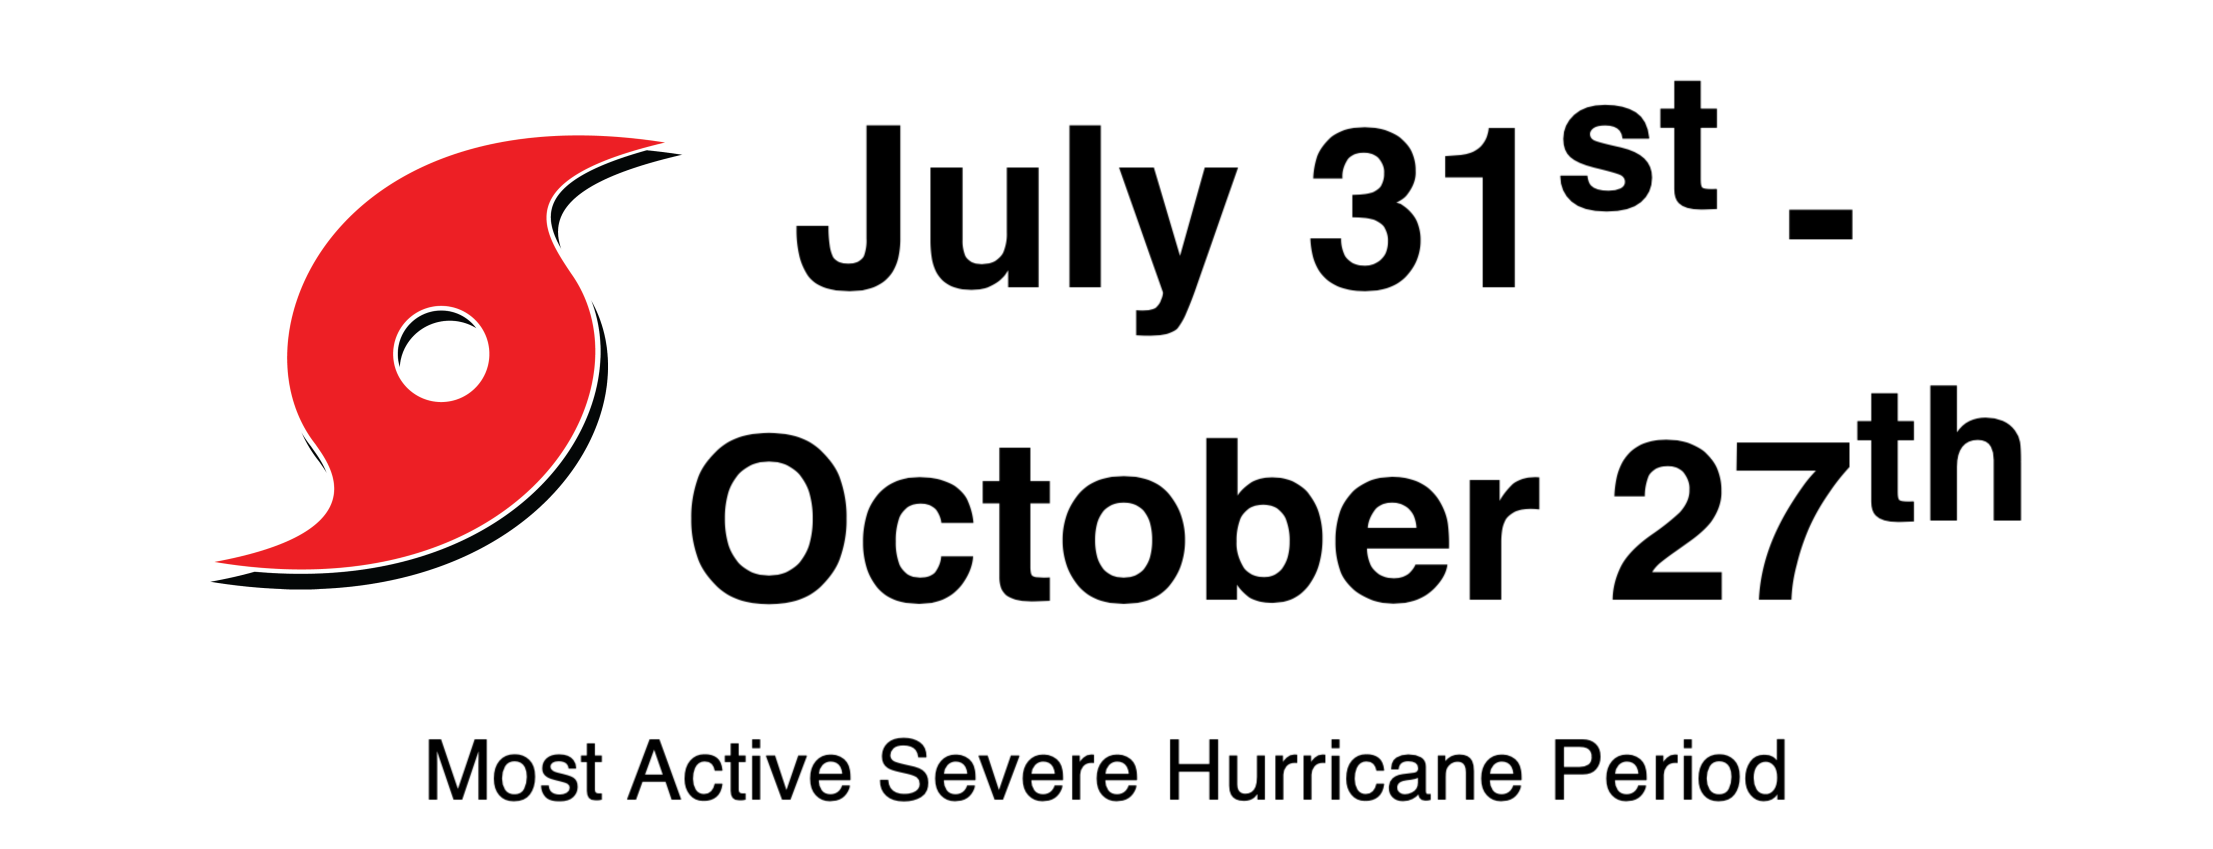
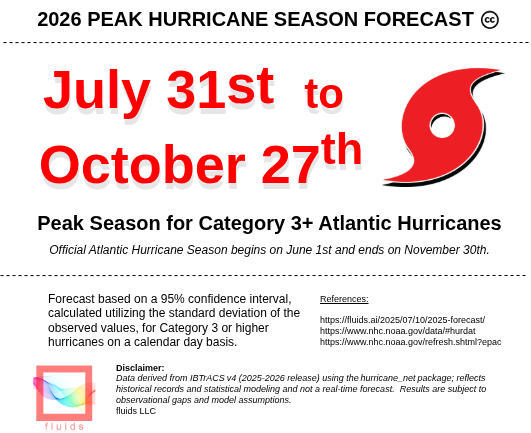
Peak Season for Category 3+ Atlantic Hurricanes
Figure 1 displays the start and end dates of the peak season for Category 3+ (Saffir-Simpson scale) storms by utilizing a statistical methodology. A 95% confidence interval, derived from a bootstrapped Kolmogorov-Smirnov test against a uniform null hypothesis, spans from day 212 (July 31) to day 300 (October 27). The official Atlantic Hurricane Season starts on June 1st and ends on November 30th.
Global Distribution of Category 3+ Storms
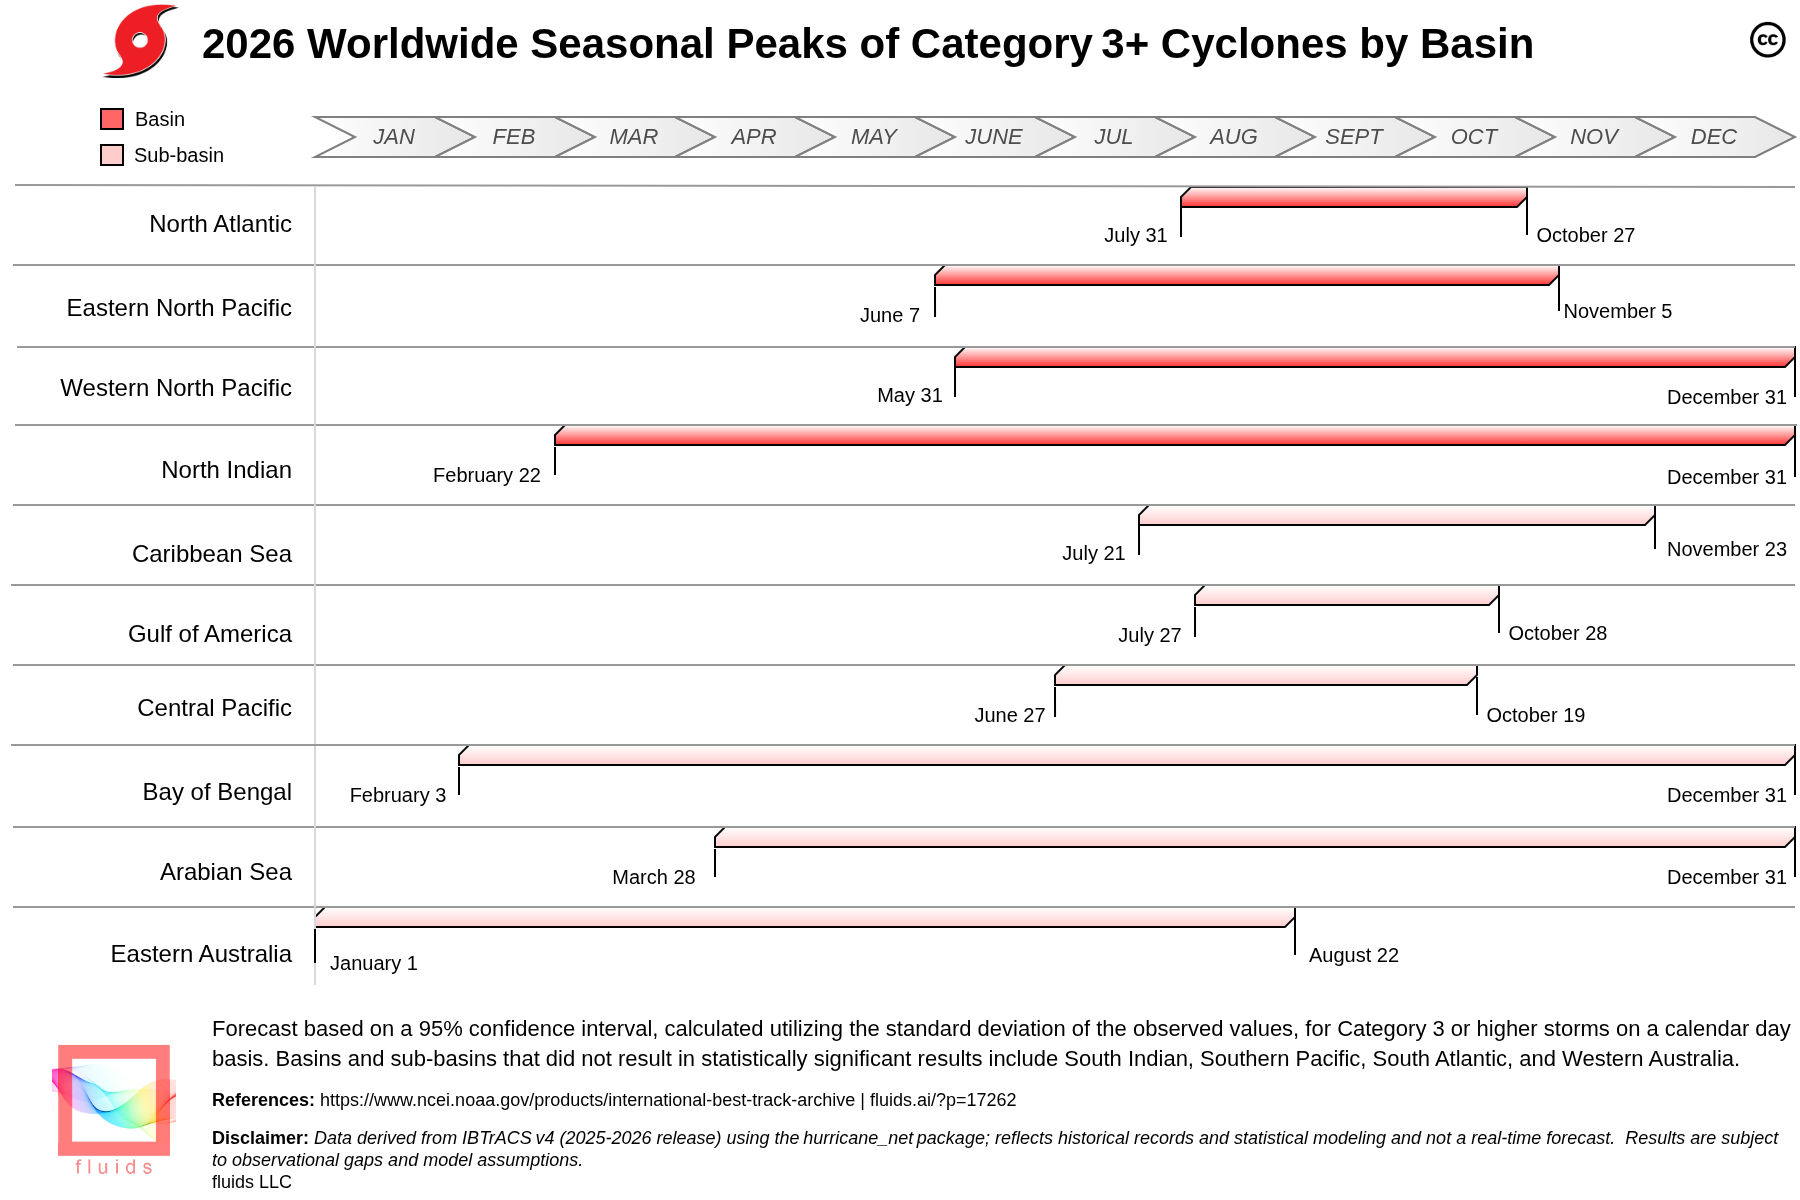
Using hurricane-net (v 0.1.4), we ingested the full IBTrACS data from the year 1851 to today. Then, a filter for storms with maximum sustained winds ≥ 96 knots was applied, and it assigned each storm observation of wind speeds to a cluster (North Atlantic, Eastern North Pacific, Western North Pacific, and North Indian basins including the Caribbean Sea, Gulf of America, Central Pacific, Bay of Bengal, Arabian Sea, and Eastern Australia sub-basins). For each cluster, we computed the total number of Category 3+ storm days and the proportion of the season during which the 95% confidence interval of activity occurs.
Figure 2 is a horizontal bar chart where each bar represent a basin. The start and end of the bar corresponds to the peak season of category 3 or greater storms. The length denotes the 95% confidence interval of the peak season window (similar to the Atlantic forecast).
Conclusion
The 2026 IBTrACS based assessment confirms that category 3+ hurricanes are far from uniformly distributed across the calendar year. In the Atlantic, the classic July 31 to October 27 window still captures the overwhelming majority of intense storms, while globally the peak periods shift according to basin-specific climatology. The integration of hurricane-net and the expanded basin coverage deliver a more comprehensive and reproducible framework for seasonal risk communication and preparedness planning.
Further Work
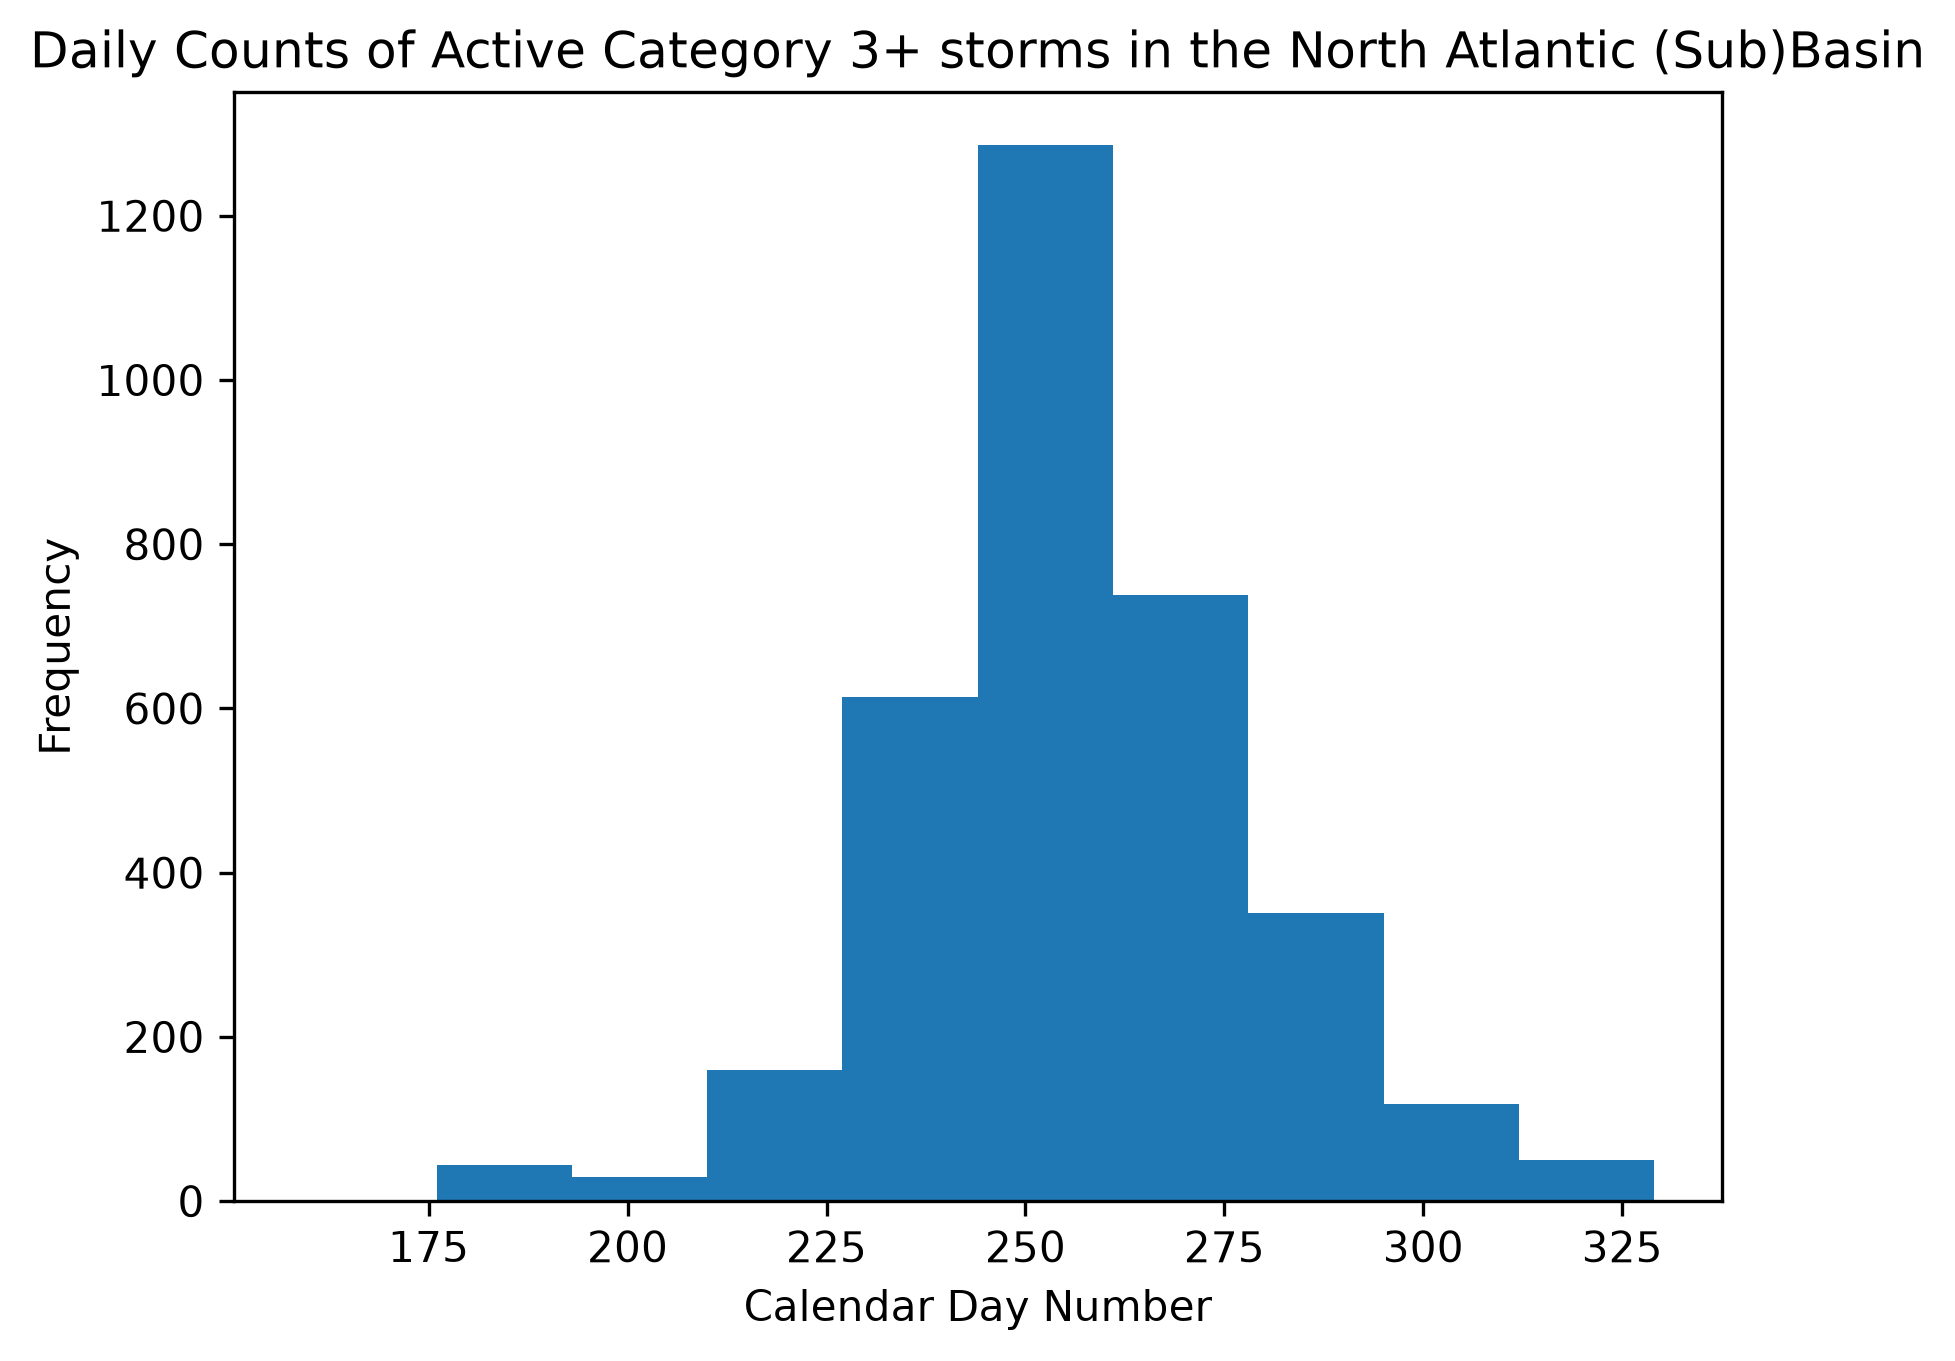
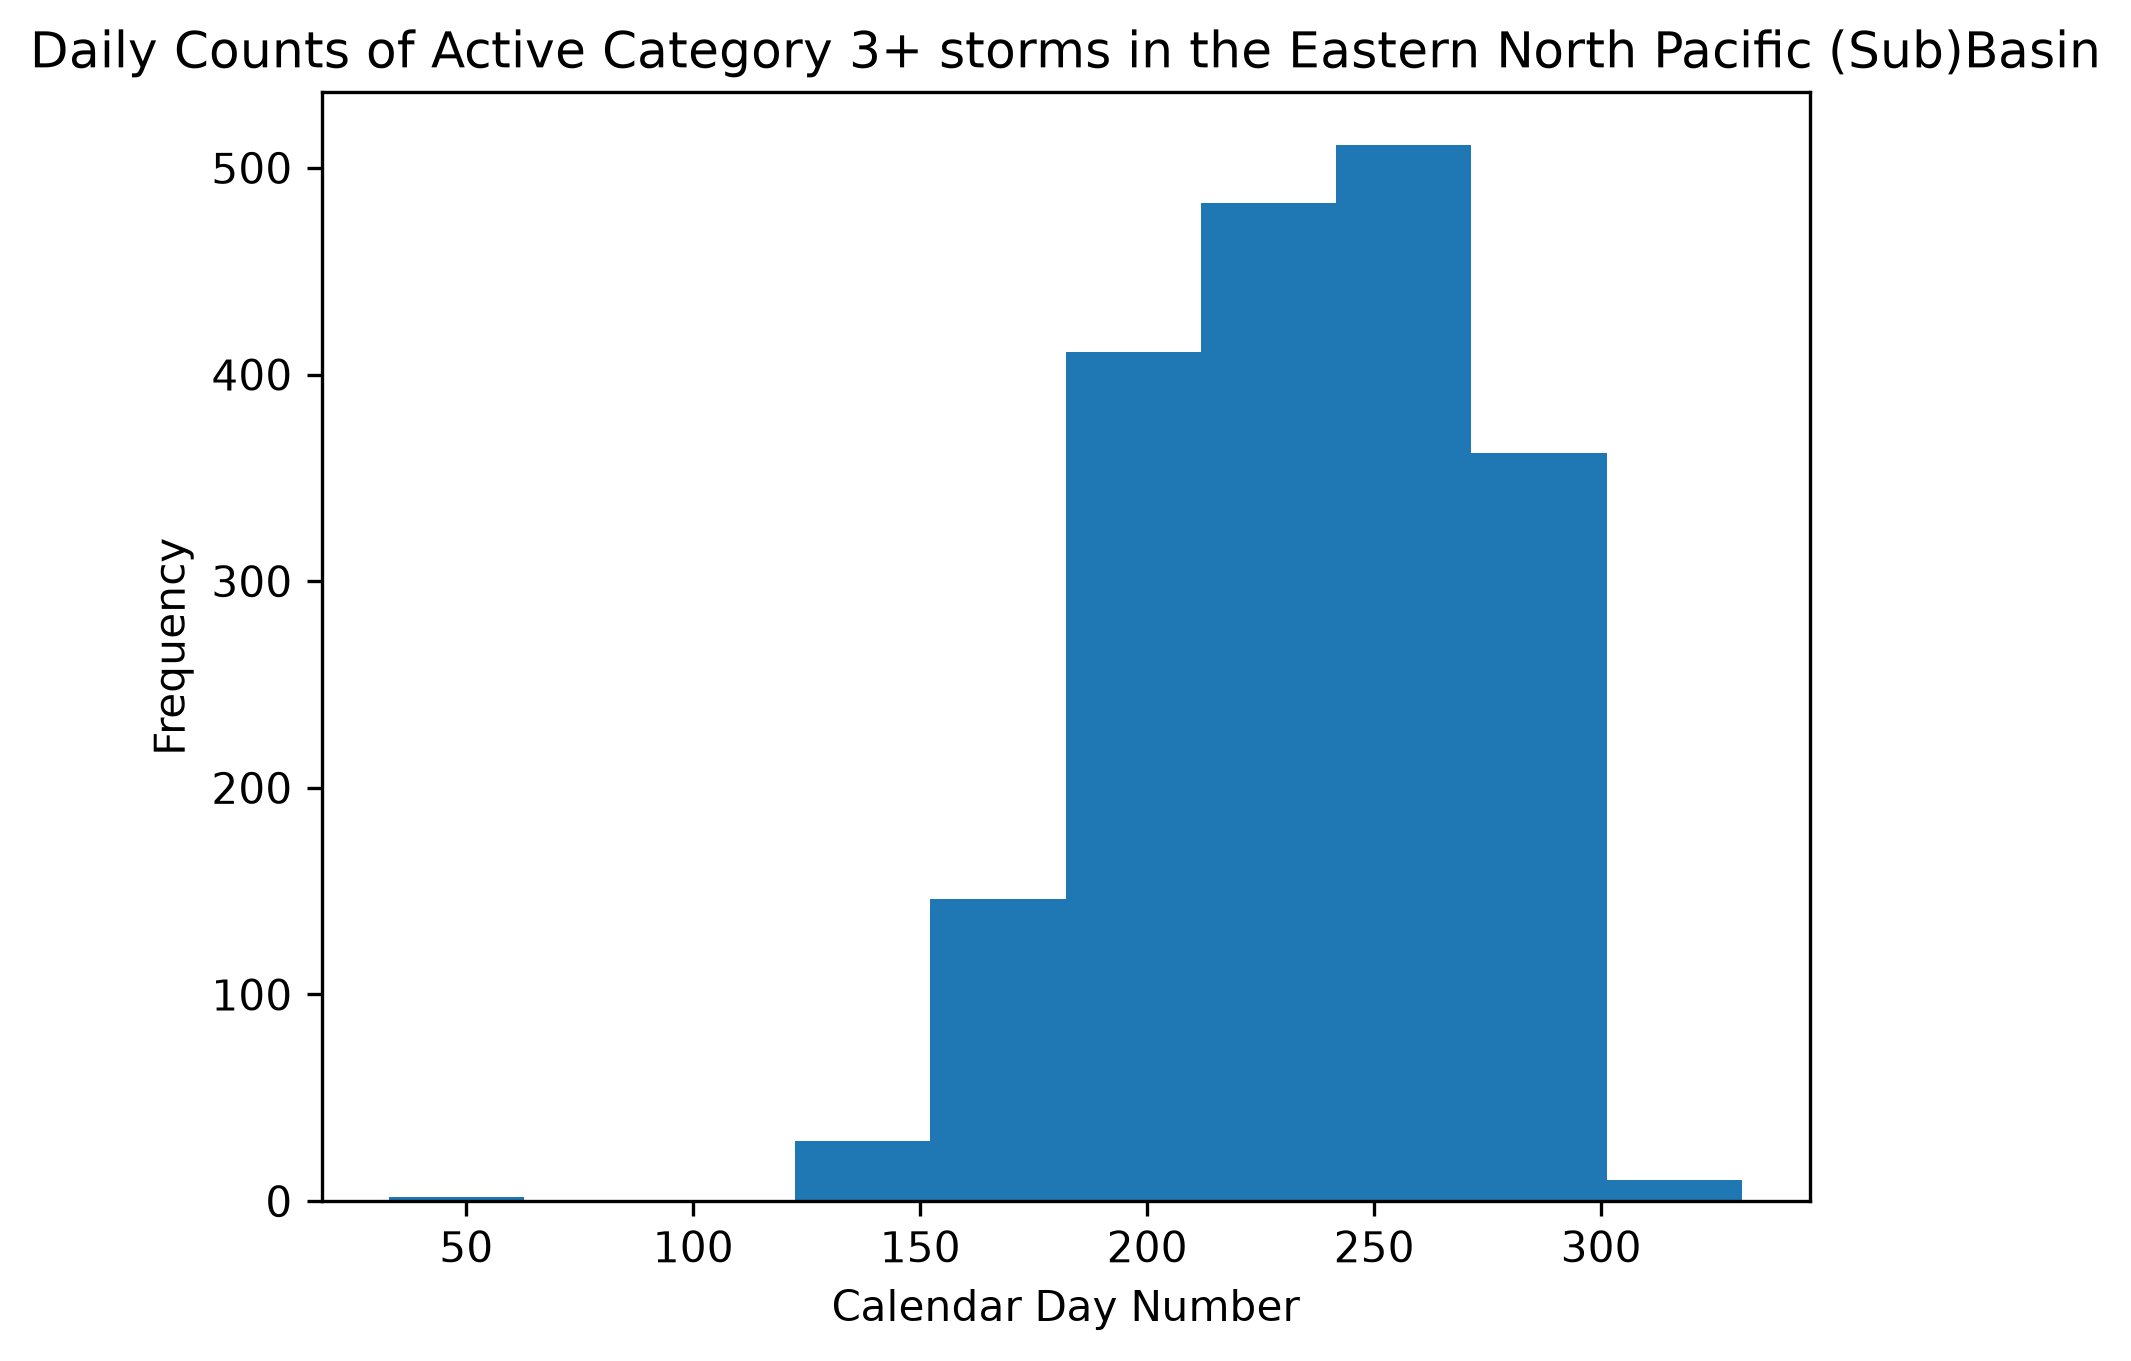
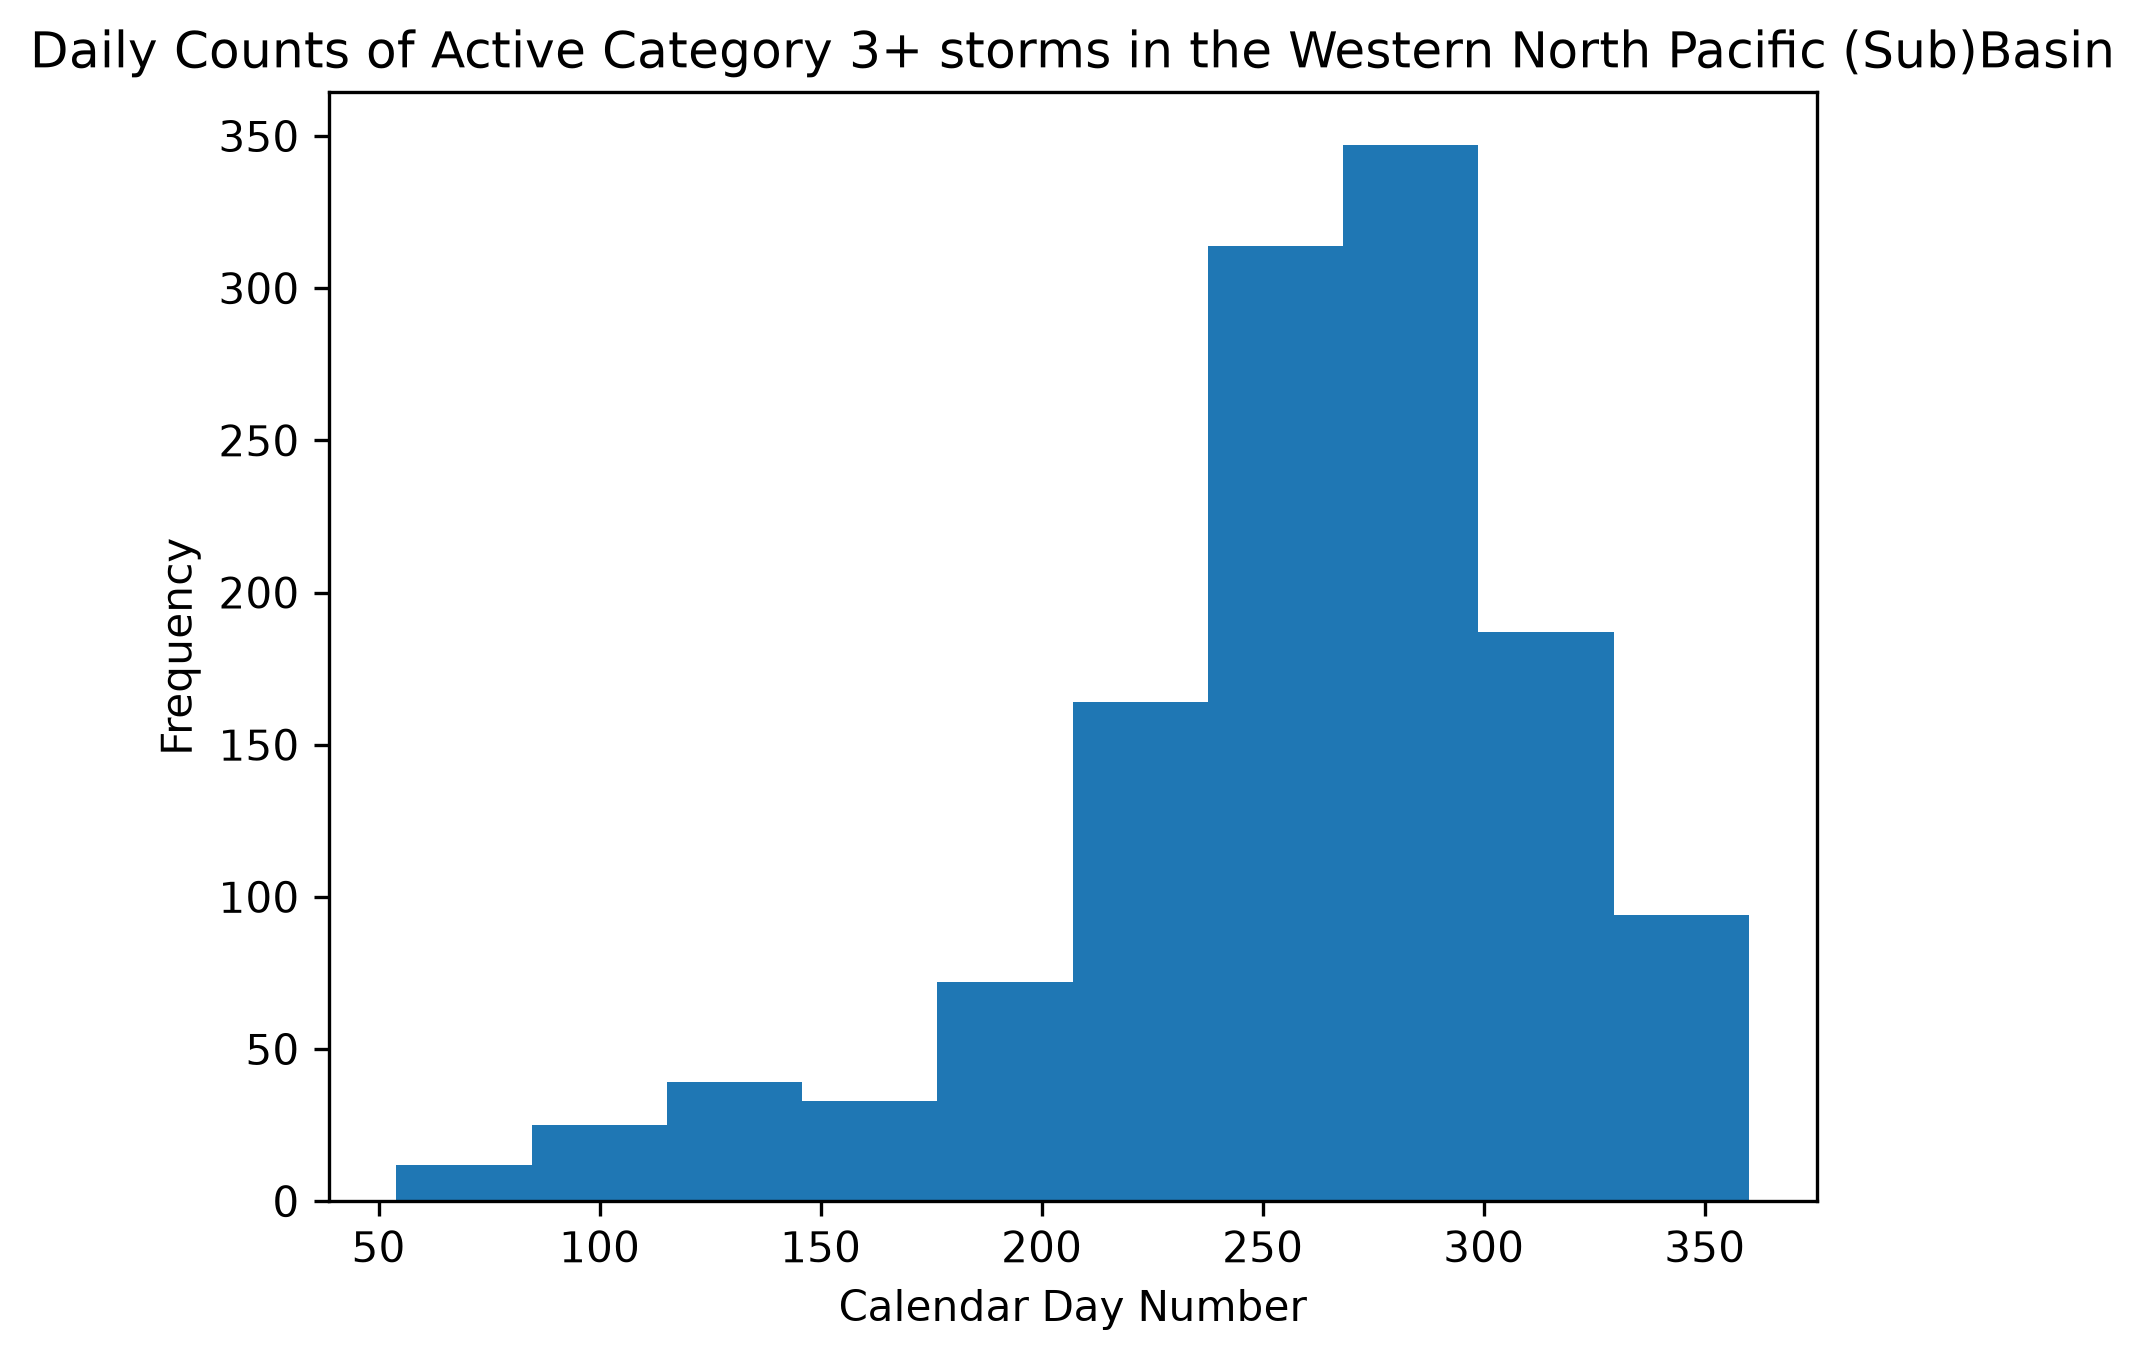
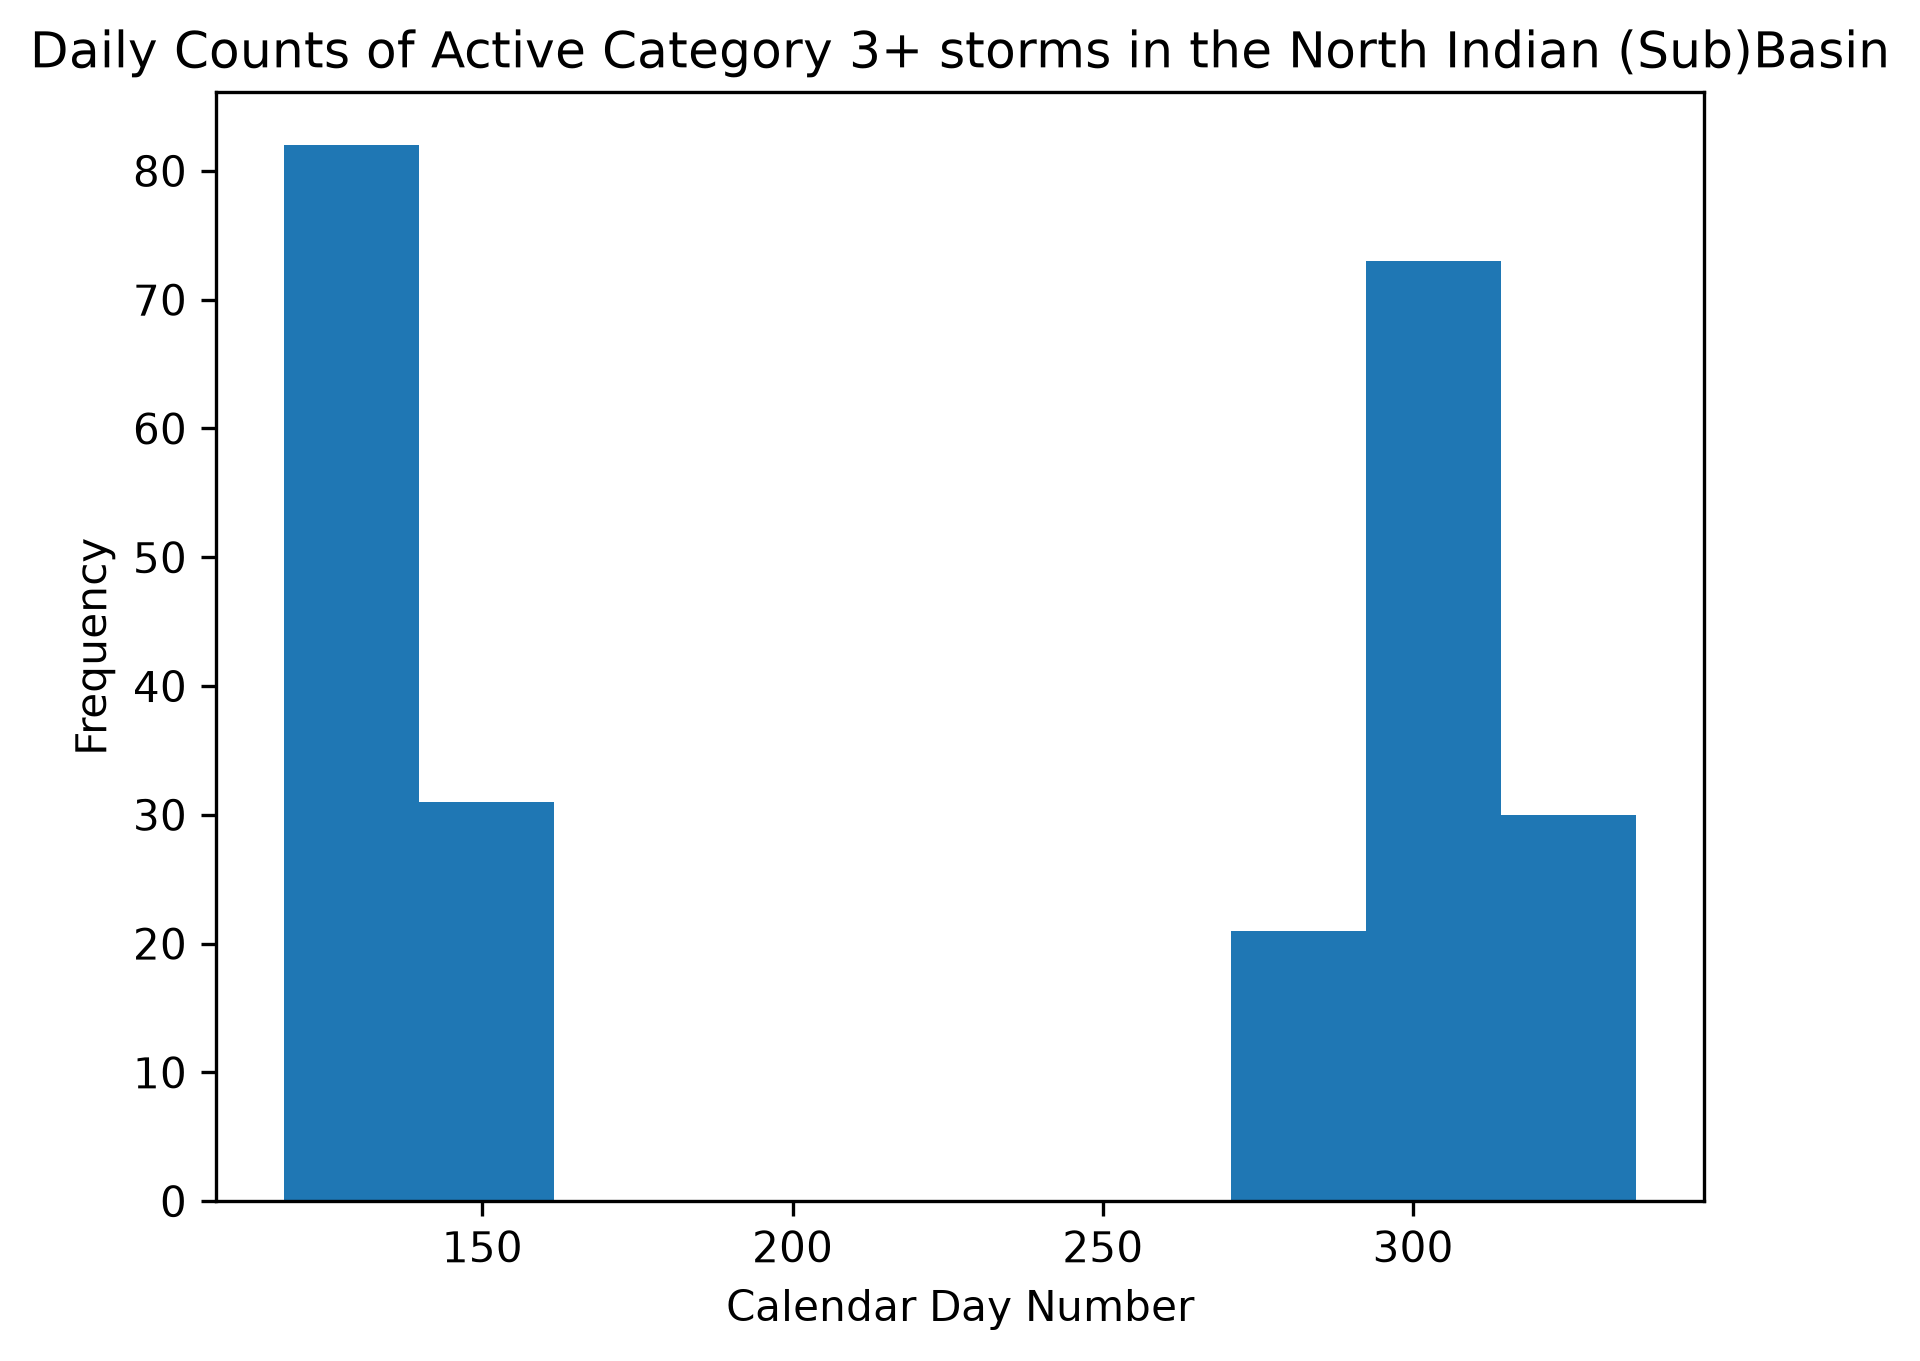
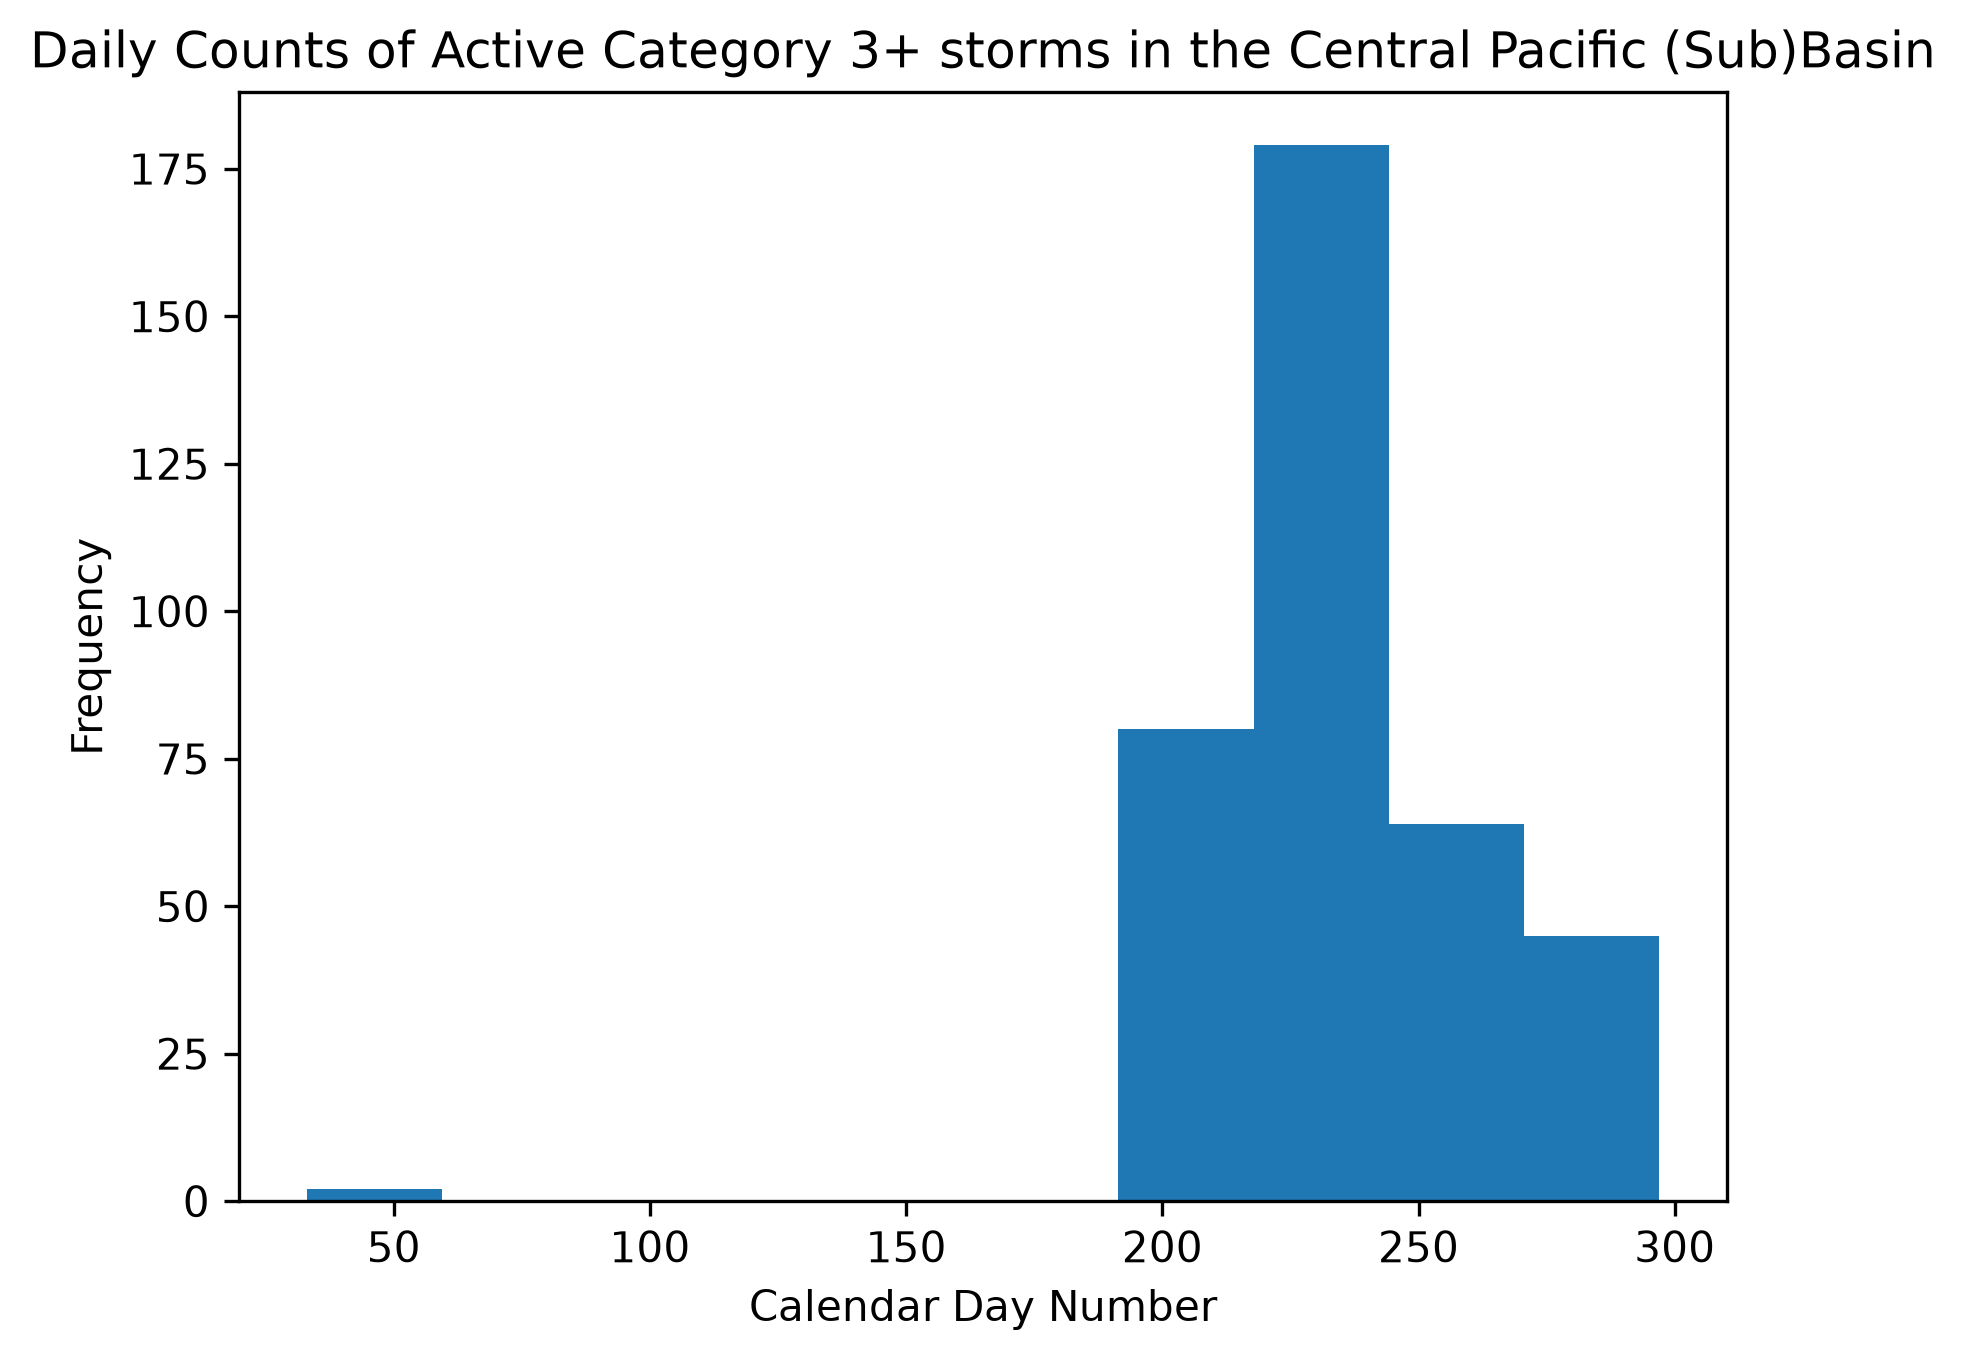
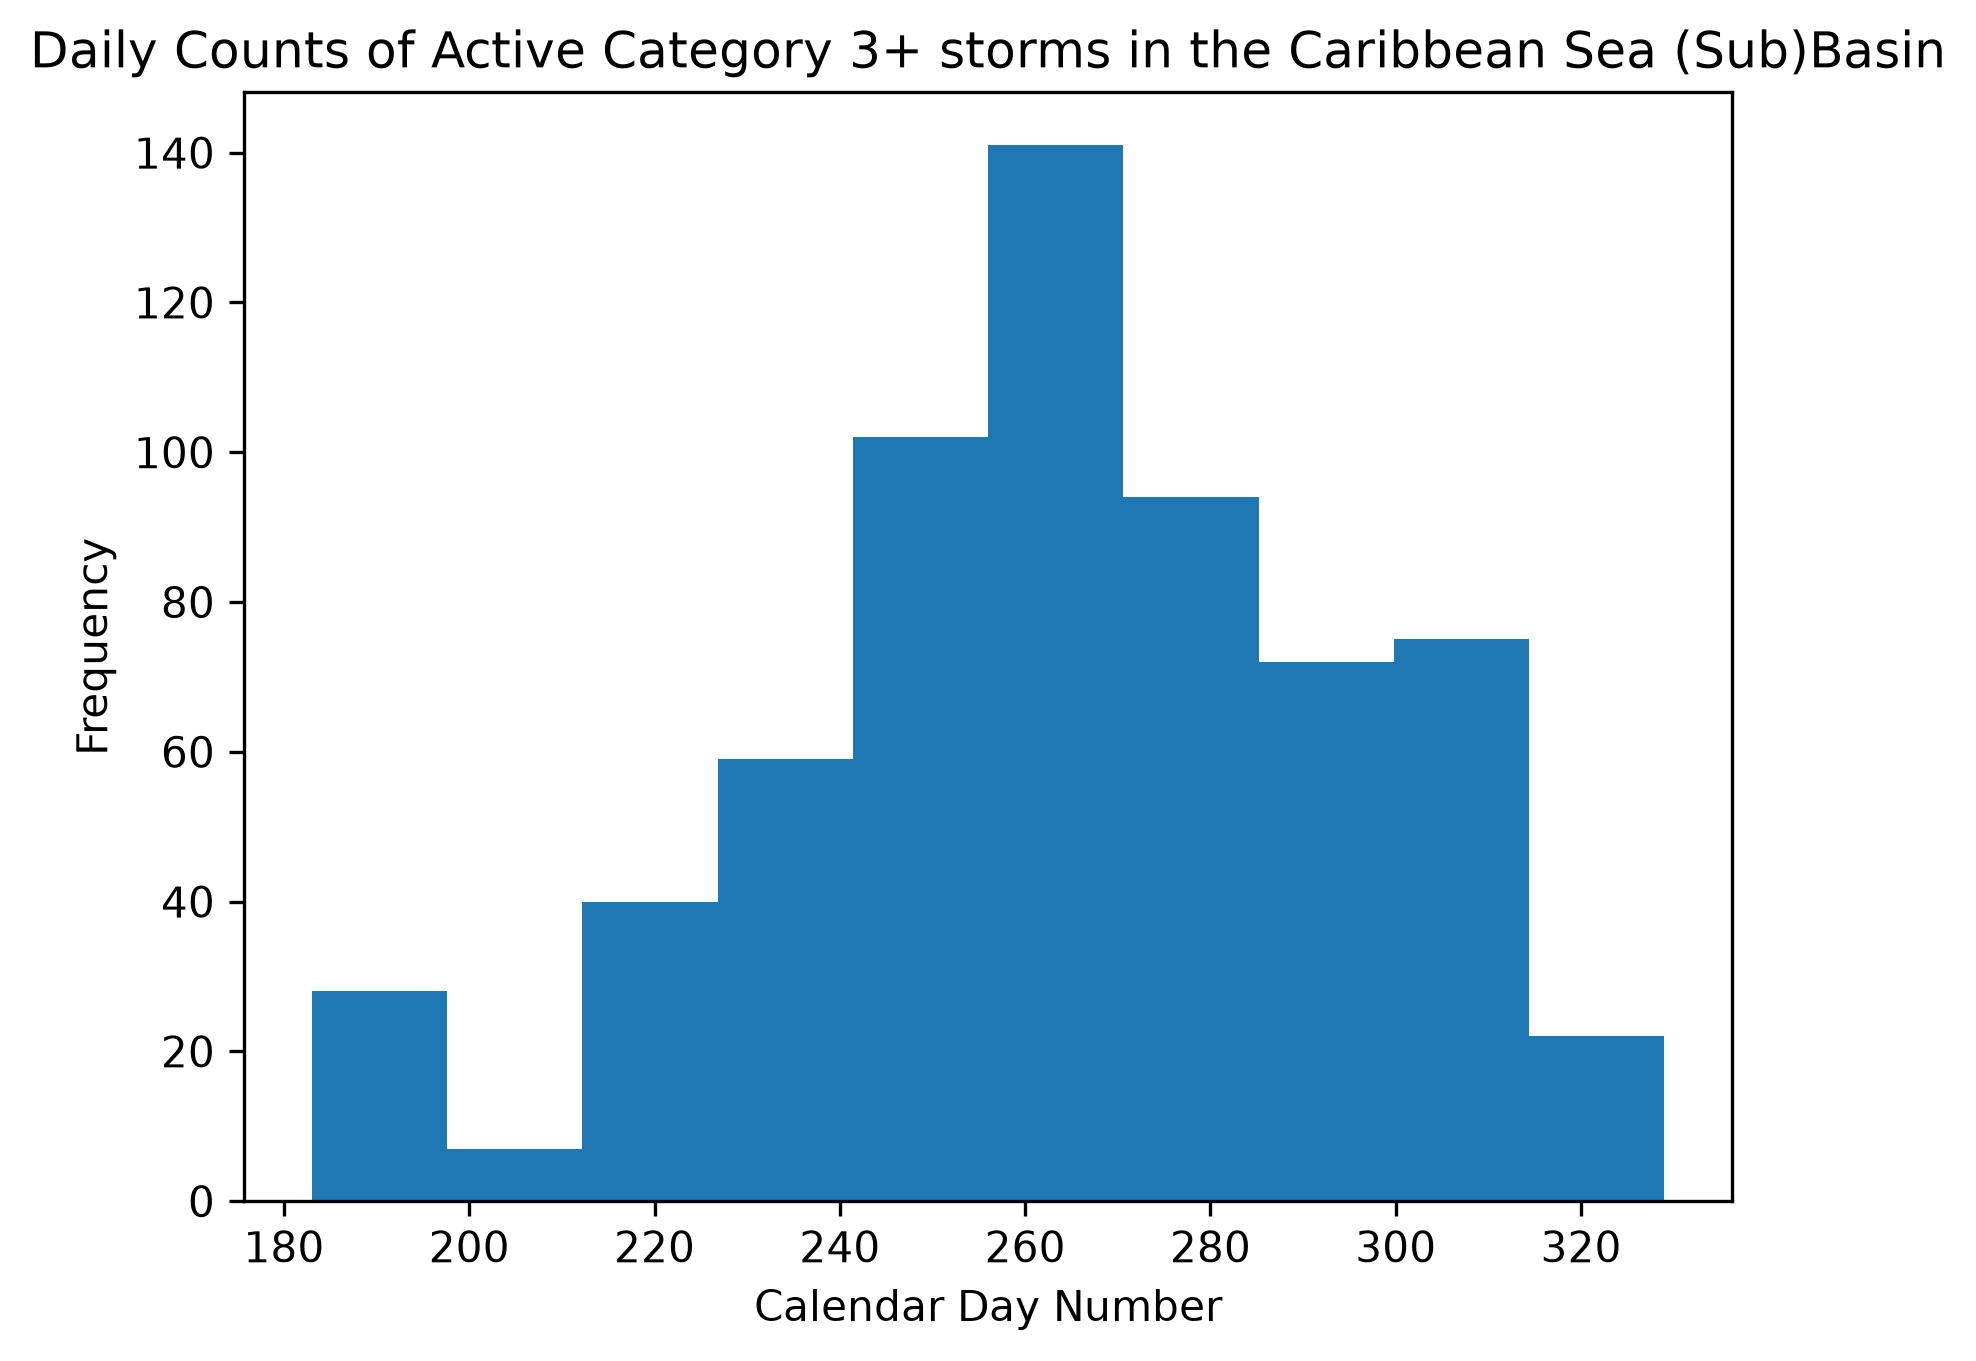
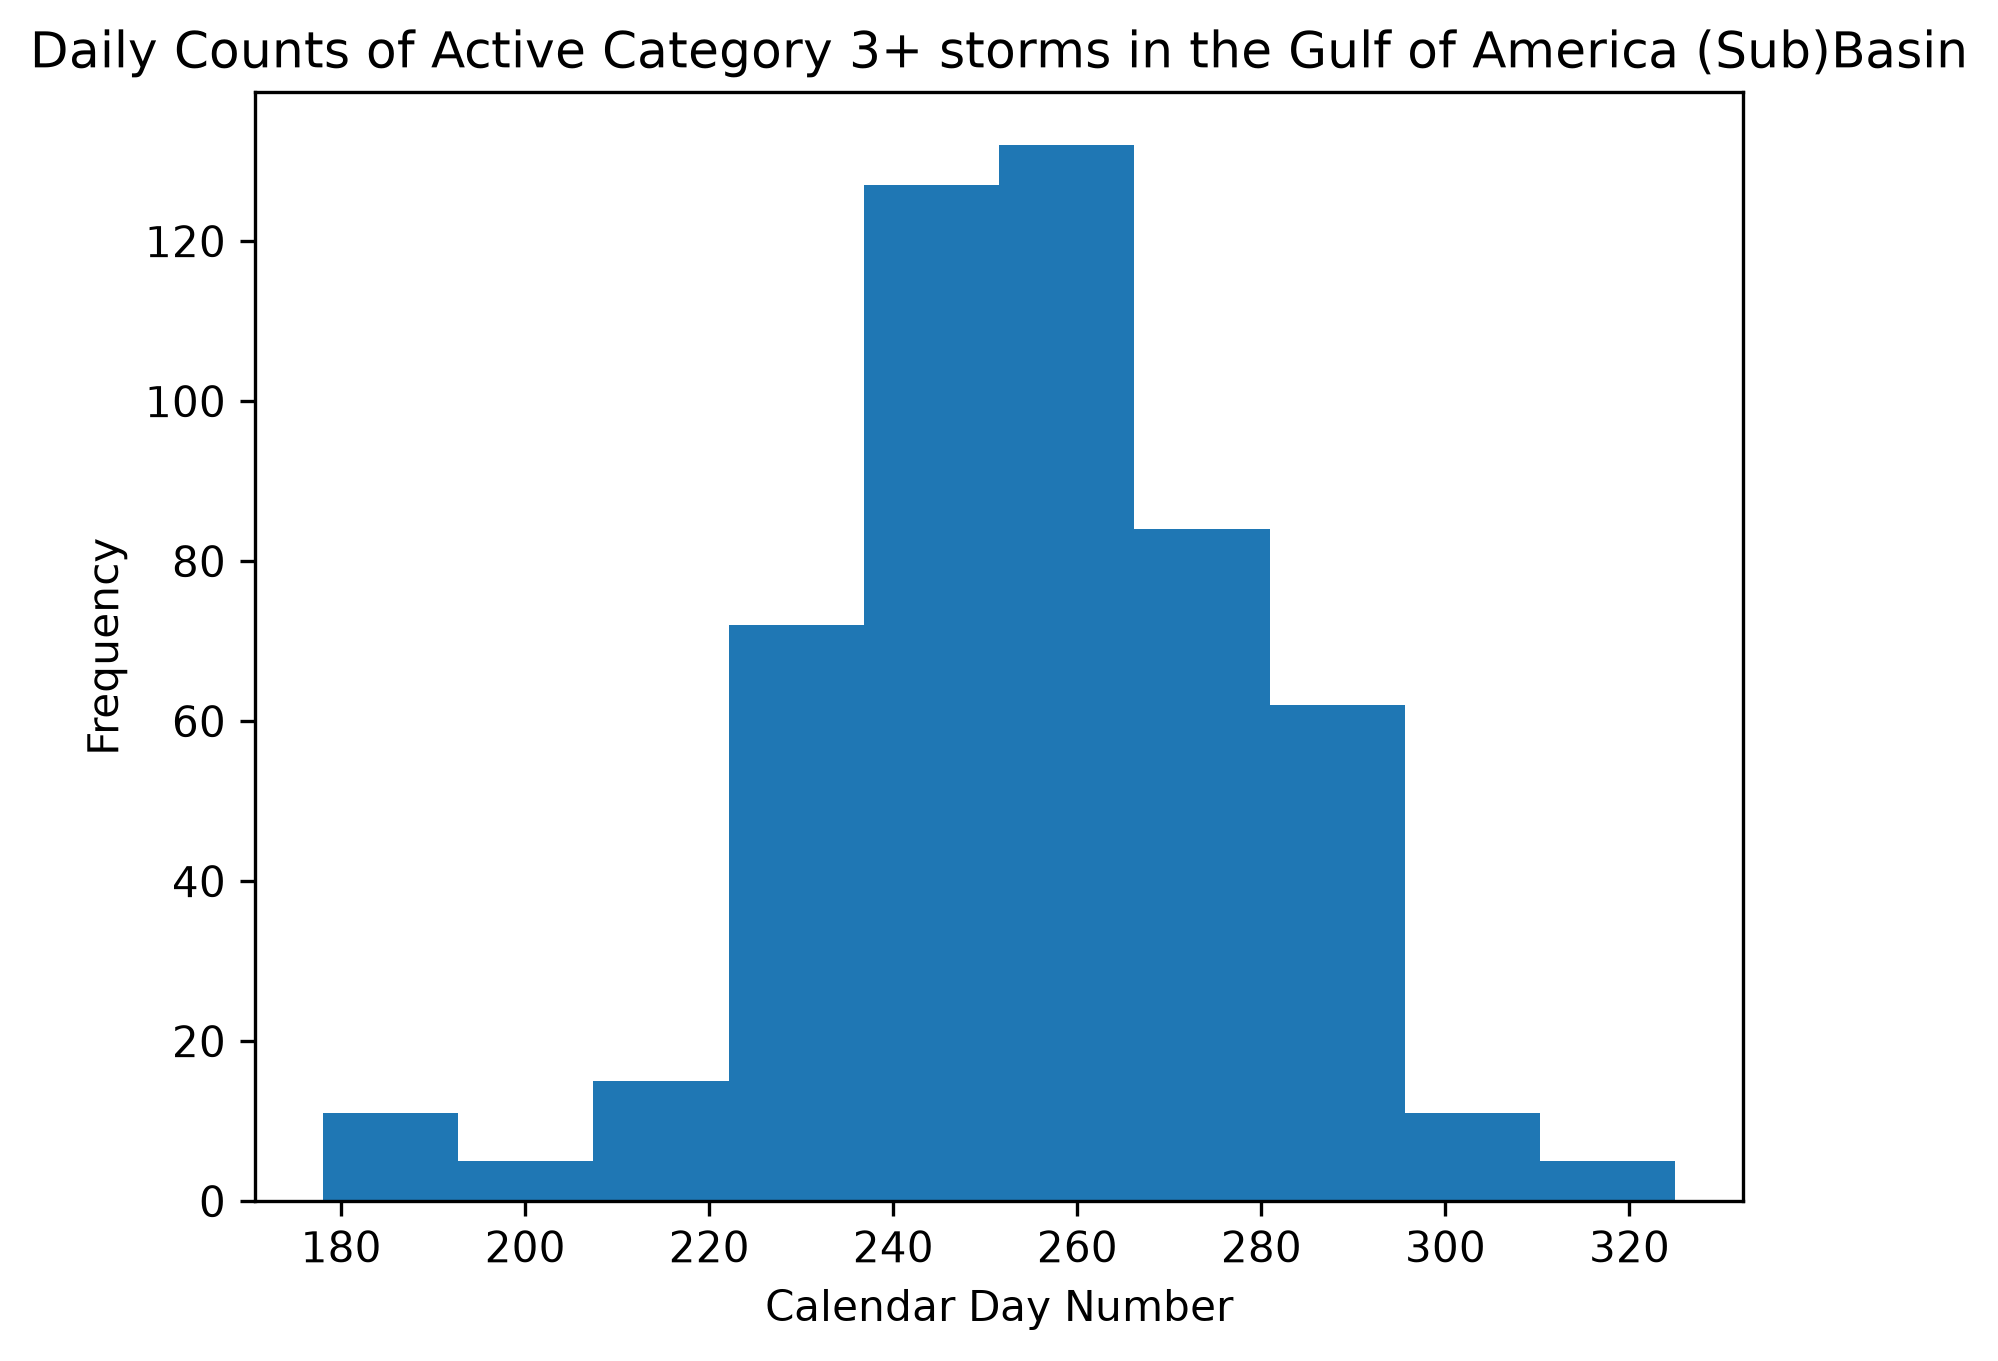
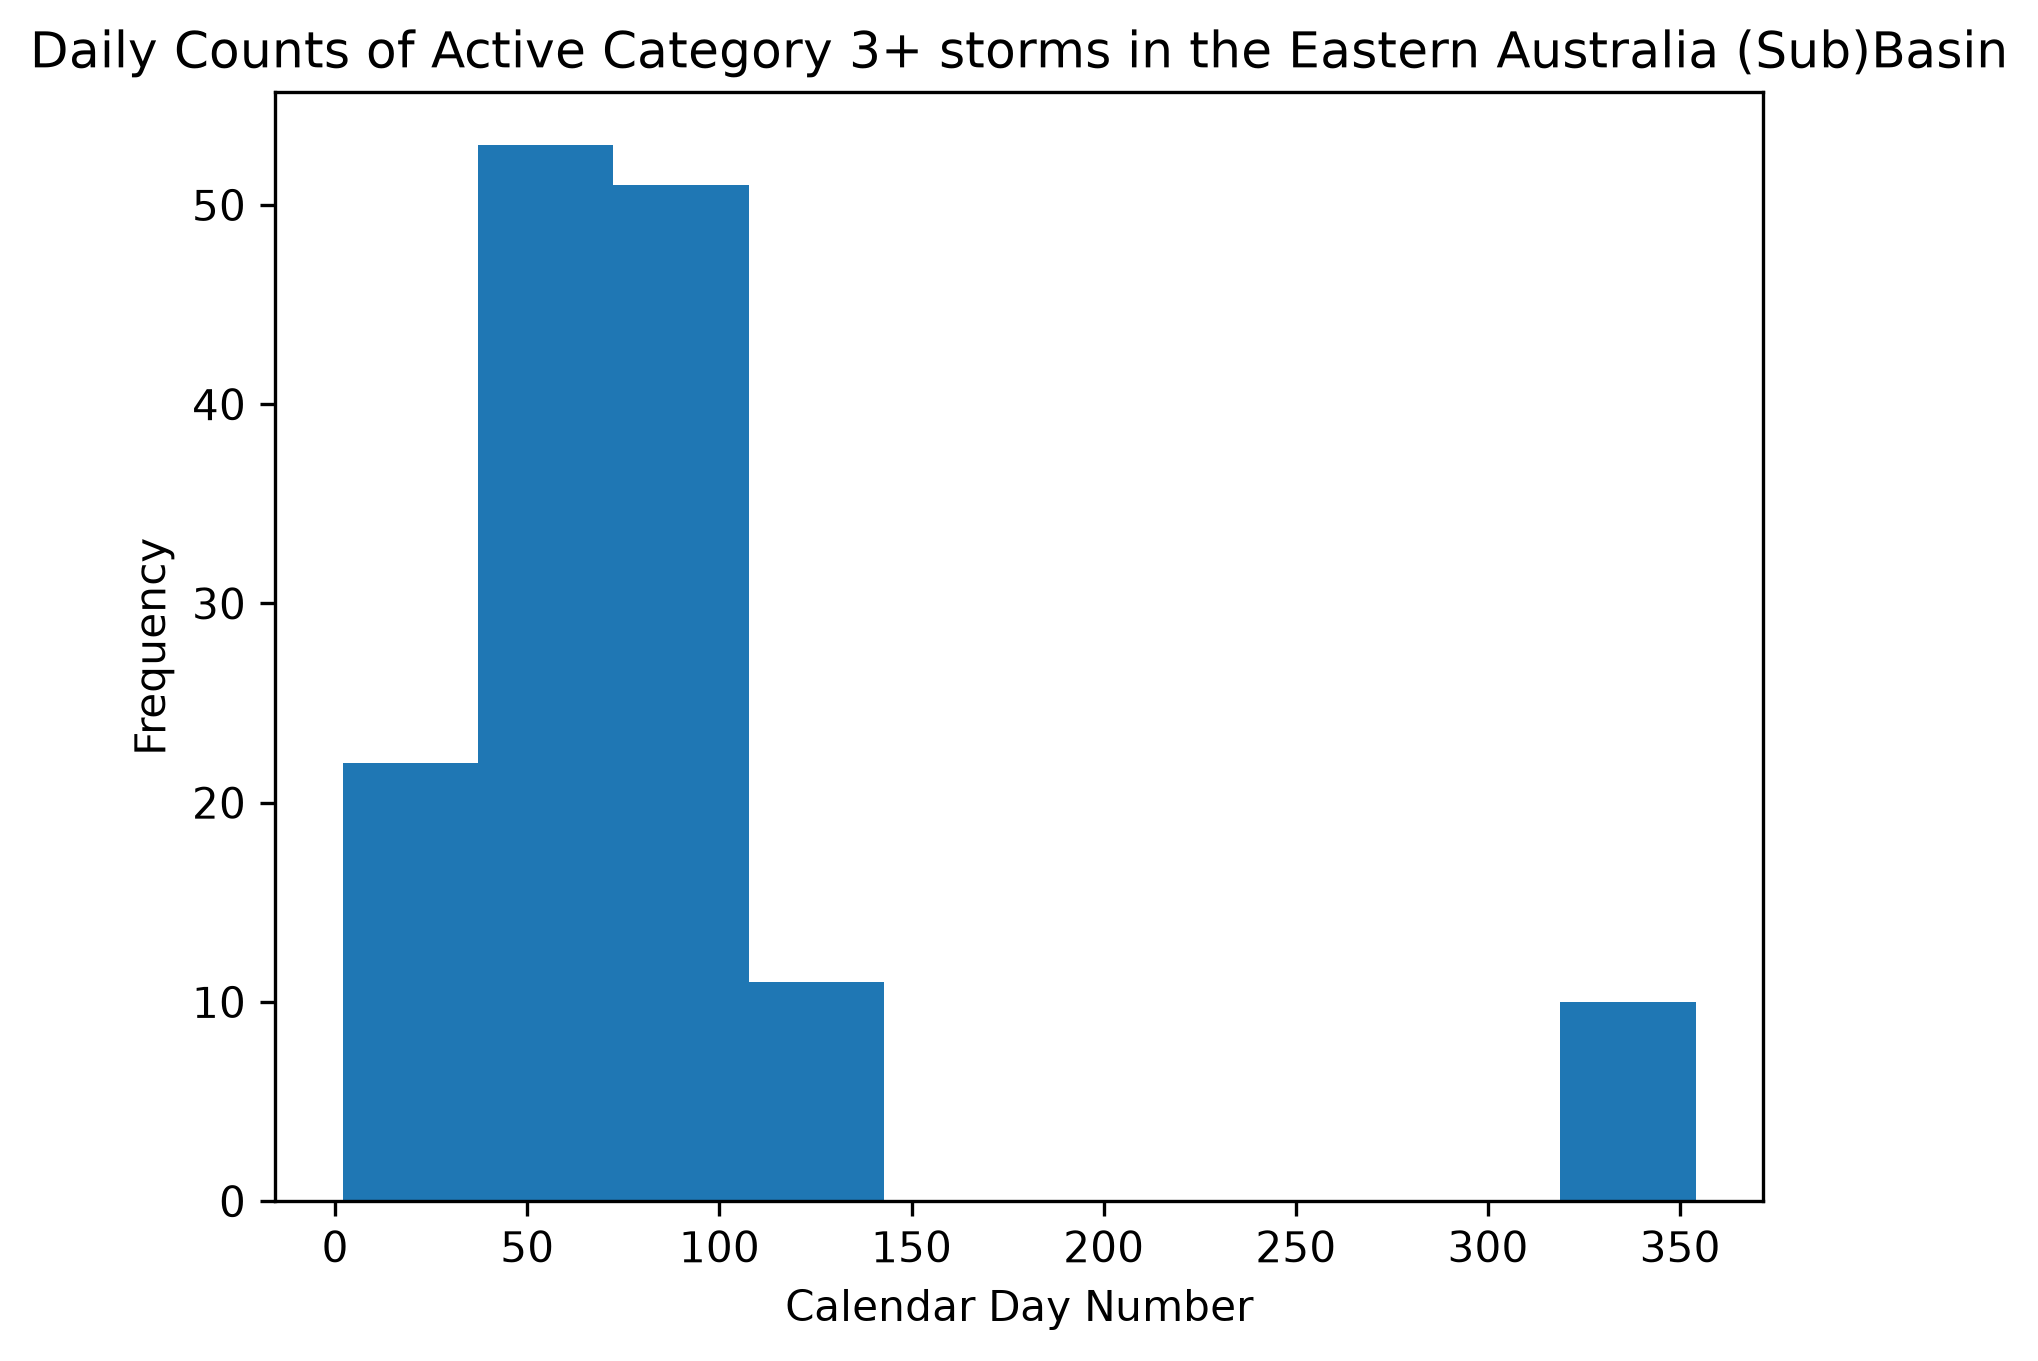
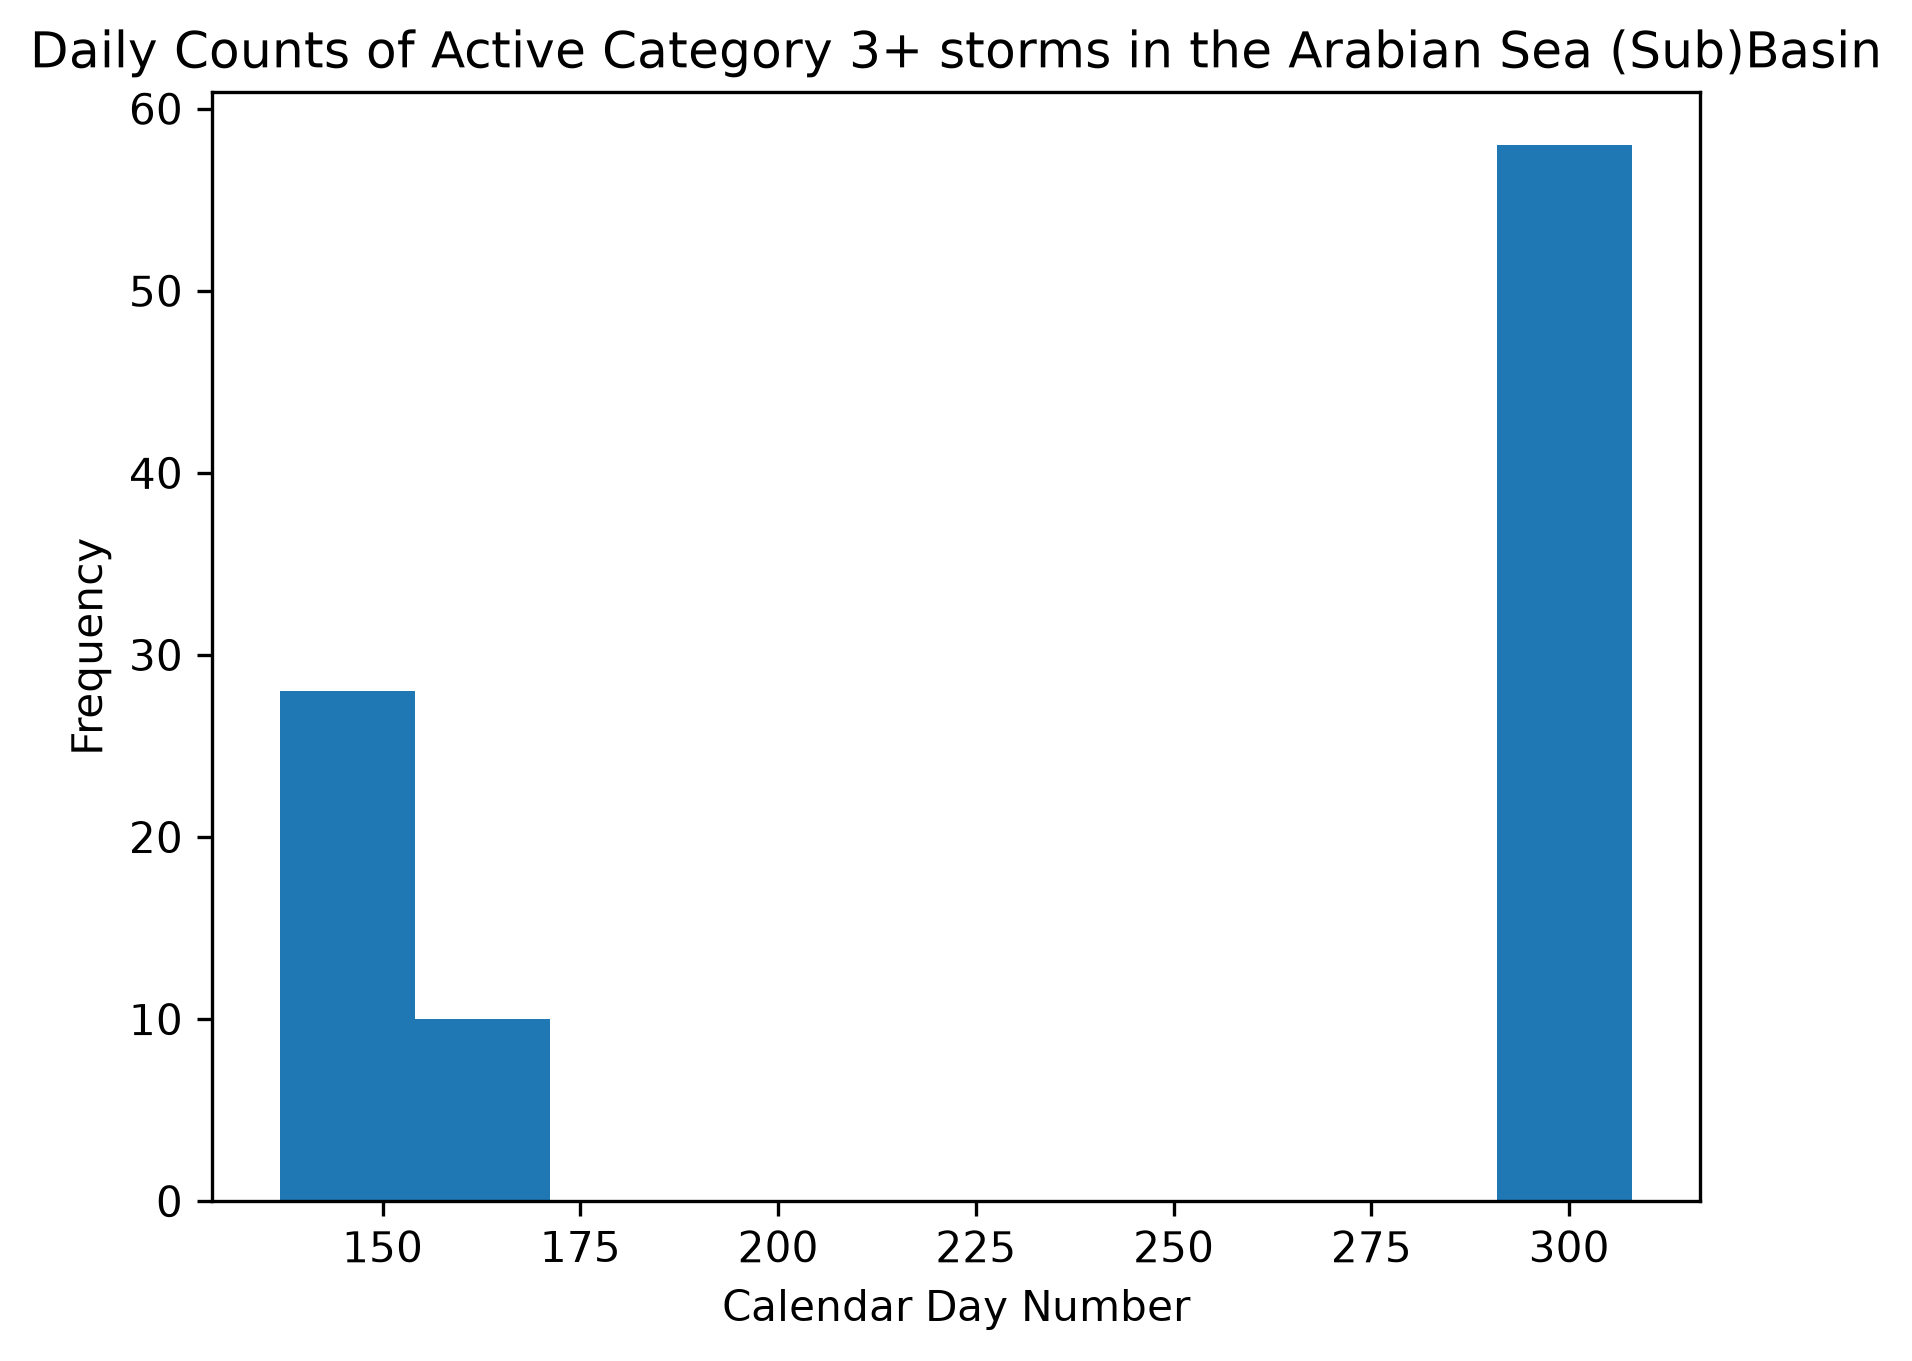
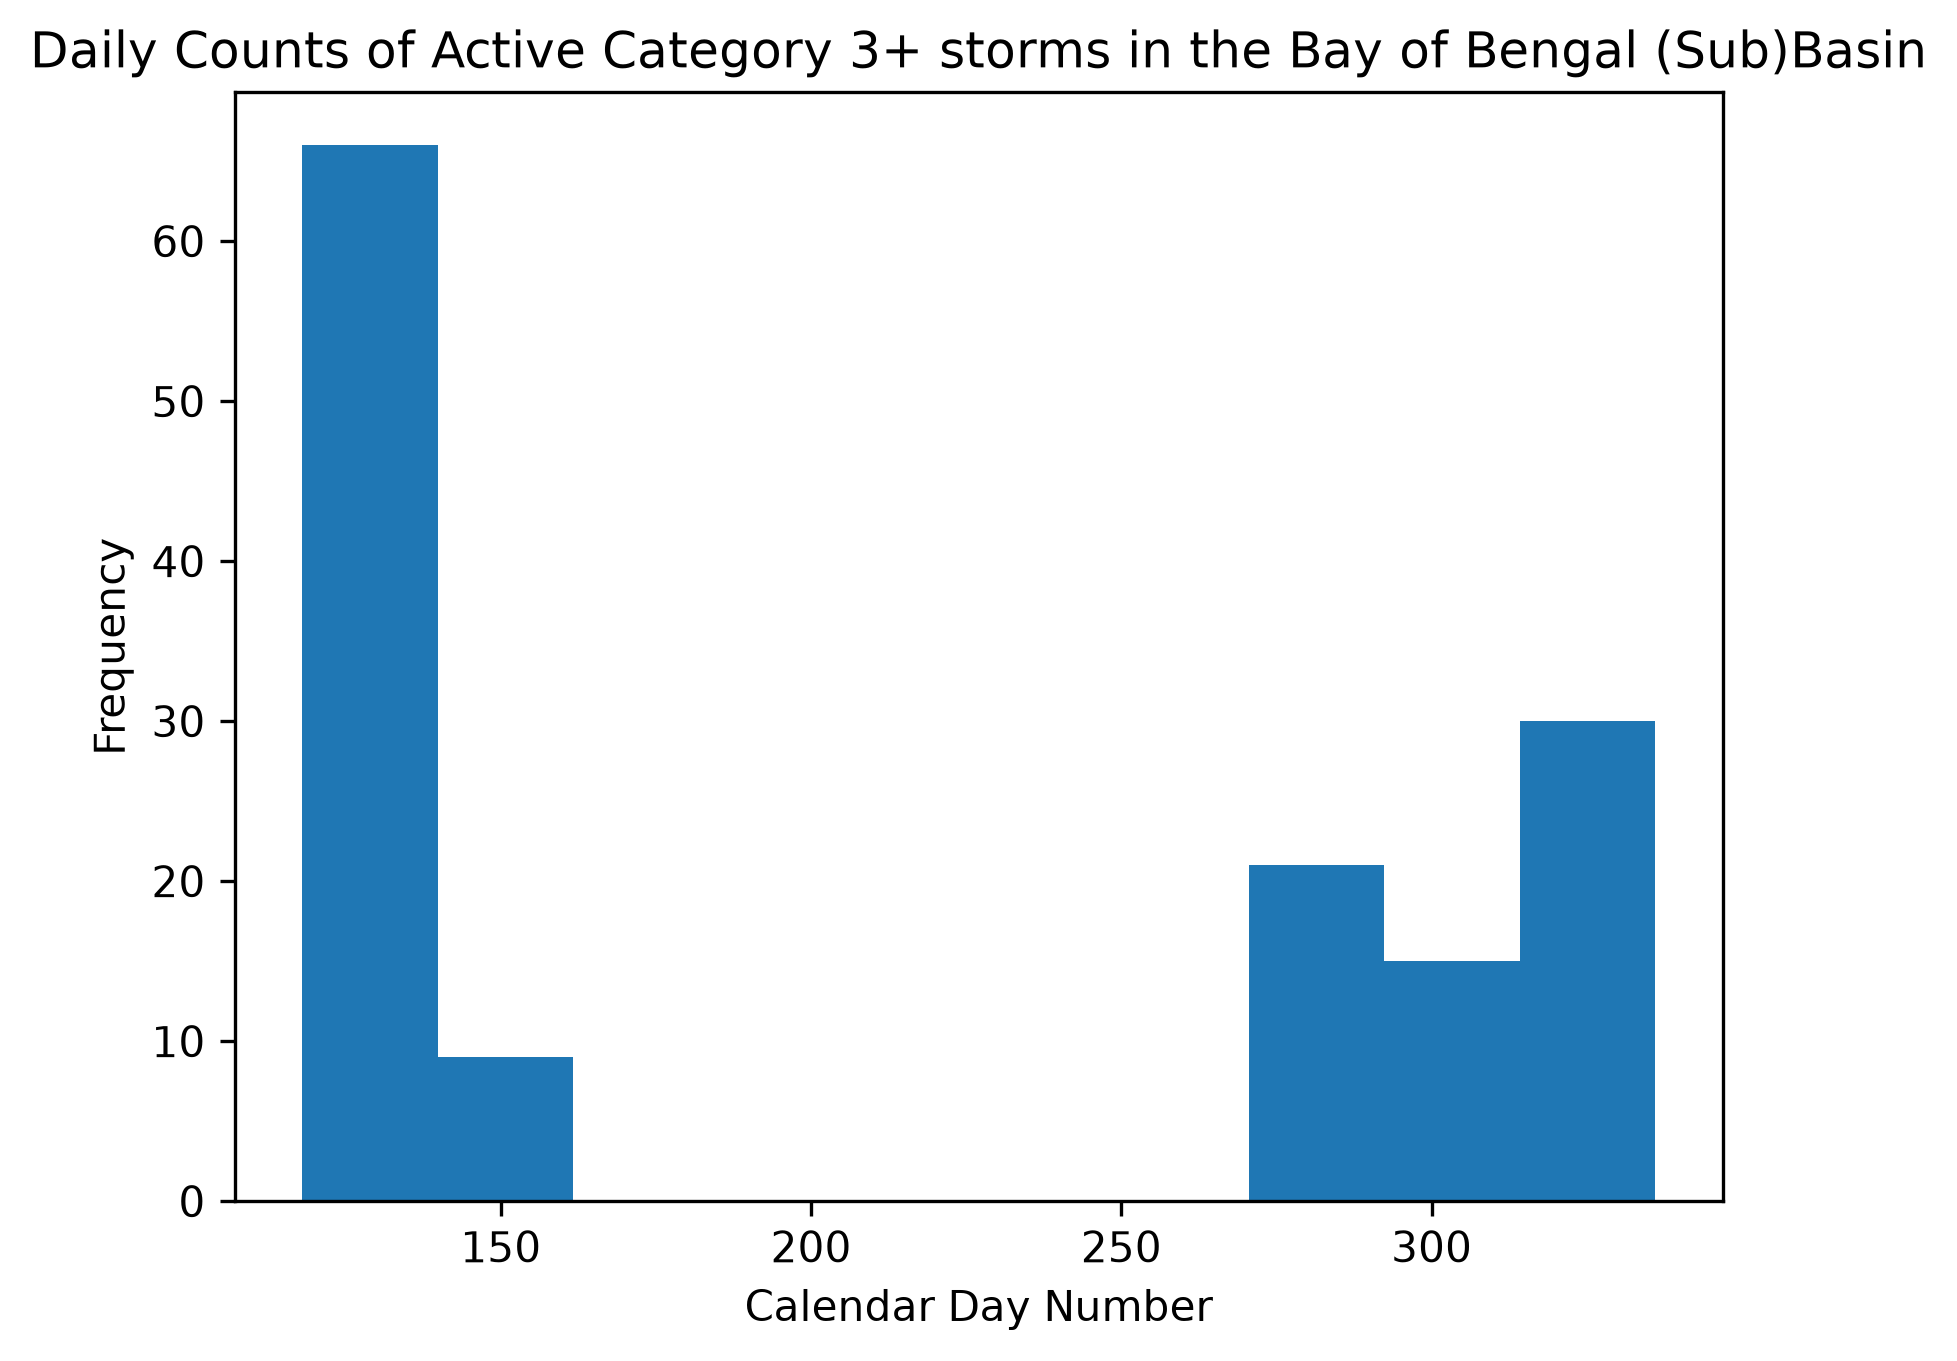
In Figure 3, the plots are presented for each basin and many of them match our assumptions. However, further variance can be reduced by considering the frequency histograms such as the Bay of Bengal sub-basin that indicate more than one discrete distribution. Furthermore, An important visualization that can enhance the contribution is a map of the paths of the severe storms in their basin. A 2027 update is planned to address these existing challenges.
References
https://www.ncei.noaa.gov/products/international-best-track-archive