Edge AI requires that the artificial intelligence calculates their responses either on your device or near the edge. Our recent developments have successfully engineered technology that achieves this goal while also alleviating environmental and safety concerns. After half a year of benchmarking, performance tuning, and monitoring, there is enough data to draw conclusions and publish our results. The benchmarking results indicate state-of-the-art performance in numerous categories for neural networks and large language models based on OpenBenchmarking. In this article, we will introduce the environmental impact of the AI server and then explore the technical challenges and innovations. This includes the total greenhouse gas emissions for 2025 and 2026 according to the GHG Protocol.
AI was not used to proofread or generate any content in this article.
Environmental Impact & Sustainability
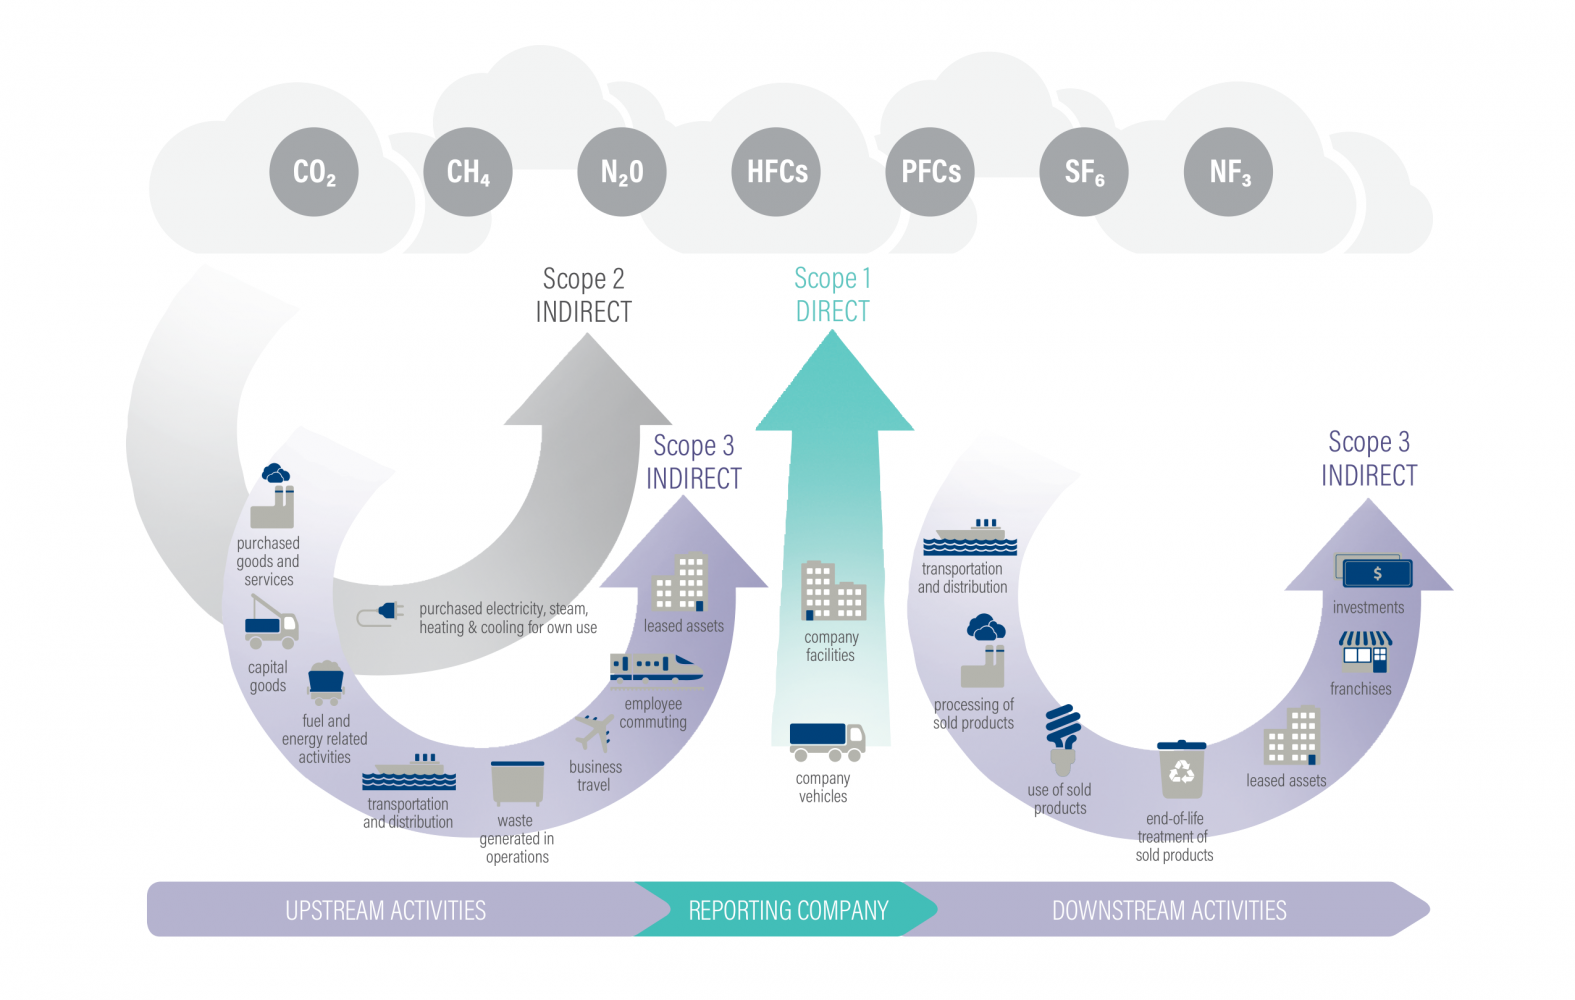
One of the main priorities of modern bleeding edge technologies include reporting on environmental impact and sustainability. Methods to quantify the affect of a technology on the climate include the Greenhouse Gas (GHG) Protocol which define the impact according to their scope. Our direct measurements of electricity usage combined with details on the manufacturing and configuration of the AI server allows calculation of scopes 1, 2, and 3. Total greenhouse gas emissions is a sum of scope 1, 2, and 3 and the goal is to reduce emissions to zero.
Scope 1
Scope 1 emissions are when the organizations direct actions produces greenhouse gas emissions such as driving a gasoline car.
In covering our direct emissions, we report 0 tCO2/year (metric tonnes of CO2 per year). The AI server is powered by electricity and the facility is a residential home; producing no carbon dioxide or direct emissions. Next, scope 2 is where we utilize the IoT energy monitoring to provide analysis for this scope of emissions we can control as compared to scope 3.
Scope 2
Scope 2 are indirect emissions that relate to how an organization purchases and produces energy.
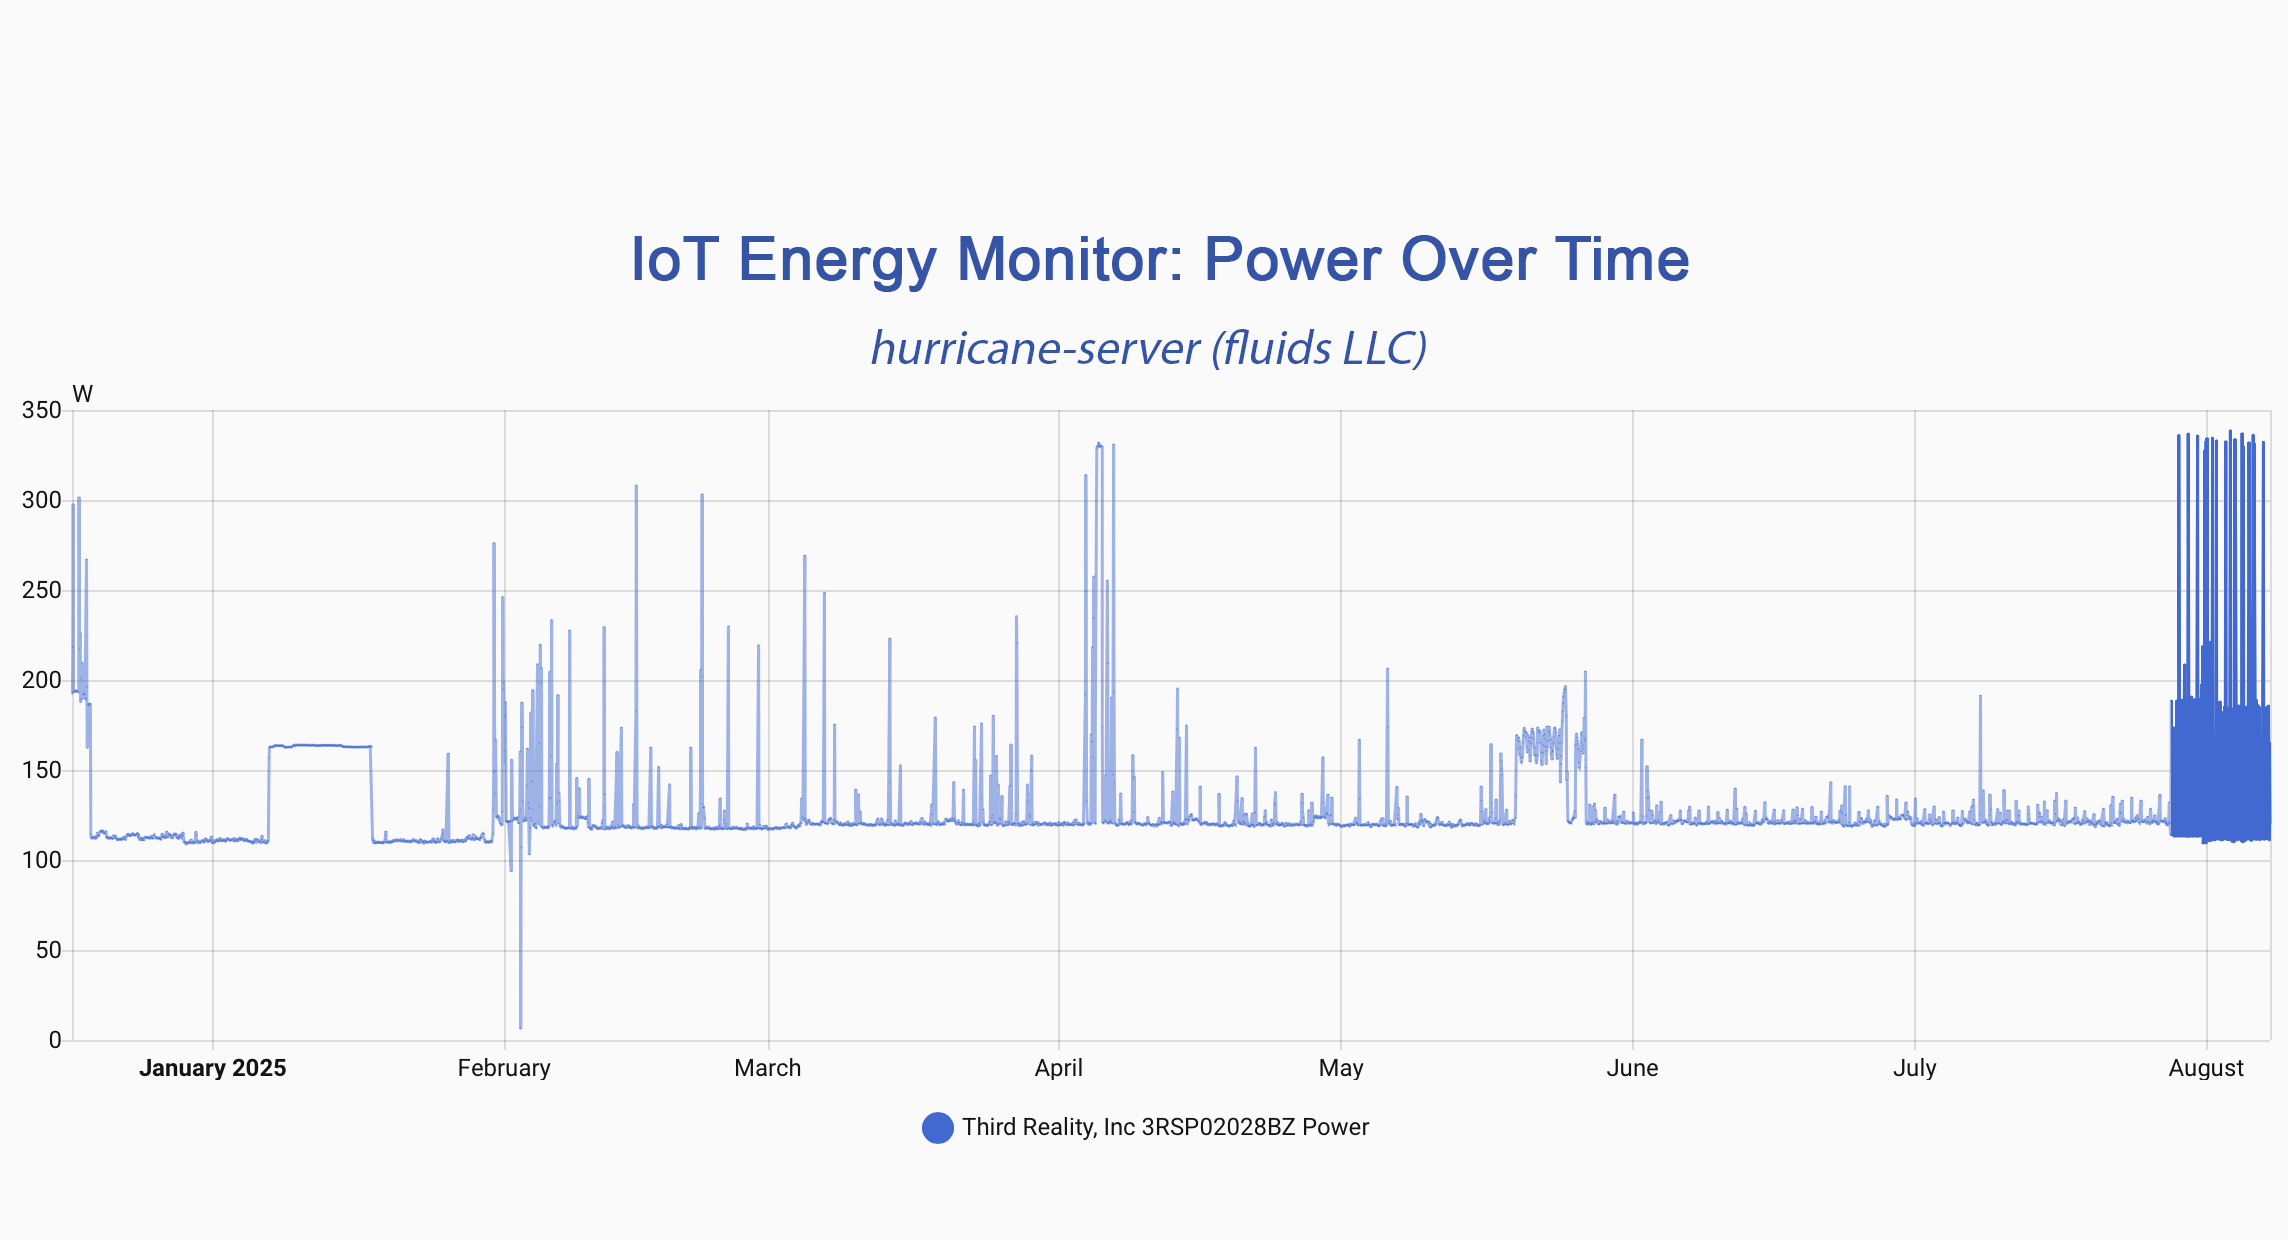
Ultimately, the AI server is connected to one outlet and one plug. While there are many advanced software based methods to measure electricity usage, they are all indirect and need complex configuration to account for everything. Therefore, we utilize a smart plug with energy monitoring right before the power cables from the server rack is connected to the outlet. This provides detailed monitoring of energy usage in real time. Through careful monitoring we’ve identified all spikes, increases, or decreases in power consumption as correlated with the AI server processing.
Looking up the value from the eGRID Subregion Total Output Emission Rates2 according to the location, we get the following result. Reproducible calculations and additional details can be found through this Python notebook3.
Equivalent Scope 2 CO2 emissions: 653.52 lbs/year (0.30 tCO2/year)
The formula from the EPA is utilized to evaluate the equivalent CO2 emissions from the AI server and it involves multiplying the total kWh consumed by the carbon intensity factor (lb/MWh) from the EPA table4. The kWh value is from the smart plug and the carbon intensity factor is according to the RFCE region where the facility is located.
However, our facility generates electricity to power the AI server through solar panels. Because it is a renewable energy source, we’re able to accomplish a total of 0 Scope 2 emissions based on the GHG Protocol5. The calculations provided are for research purposes to assess possible environmental concerns.
Scope 3
Scope 3 includes all other indirect emissions
Because fluids LLC operates online, there are a few categories of scope 3 emissions that are required like emissions for manufacturing the hardware and emissions from training the AI. The hardware was partially sourced from refurbished parts which not only reduces costs but also eliminates the manufacturing emissions. The total newly manufactured hardware is about what’s found in a laptop. Our approximation of the manufacturing emissions of all the new parts is equivalent to the “average carbon footprint of 331 kilograms of CO2 equivalent (CO2e) for a new laptop during production”6 or 0.331 tCO2.
The training process of AI requires power hungry GPU’s operating for an extended period of time from weeks to months. We include the emissions from training an equivalent large language model in our scope 3 emissions for the first year. Our estimate is 50.2 tonnes7 from a study where the BLOOM language model was trained on 176 billion parameters.
Total Greenhouse Gas (GHG) Emissions
In 2025, both scope 1 and 2 emissions are zero. Scope 3 emissions include both the manufacturing of the AI server hardware (0.331 tonnes) and emissions created by training the large language model (LLM) detailed in the Scope 3 section (50.2 tonnes) totaling 50.531 tCO2 emissions. This is only applicable to 2025 when the AI server began operations and includes these fixed emissions. Note that the emissions from training the initial LLM is scope 3 because it’s from a foundational AI supplier like HuggingFace8. The AI server downloads the neural network for the LLM but we account for the emissions produced to create it from the supplier. Subsequent emissions from AI are captured in scope 2 because it’s running on our own hardware.
| Scope | 2025 Total tCO2 |
2026 Total tCO2 |
|---|---|---|
| 1 | 0 | 0 |
| 2 | 0 | 0 |
| 3 | 50.531 | 0 |
| Grand Total | 50.531 | 0 |
Figure 2. fluids LLC Greenhouse Gas (GHG) Emissions for 2025 and 2026
Server Specifications & Benchmarking
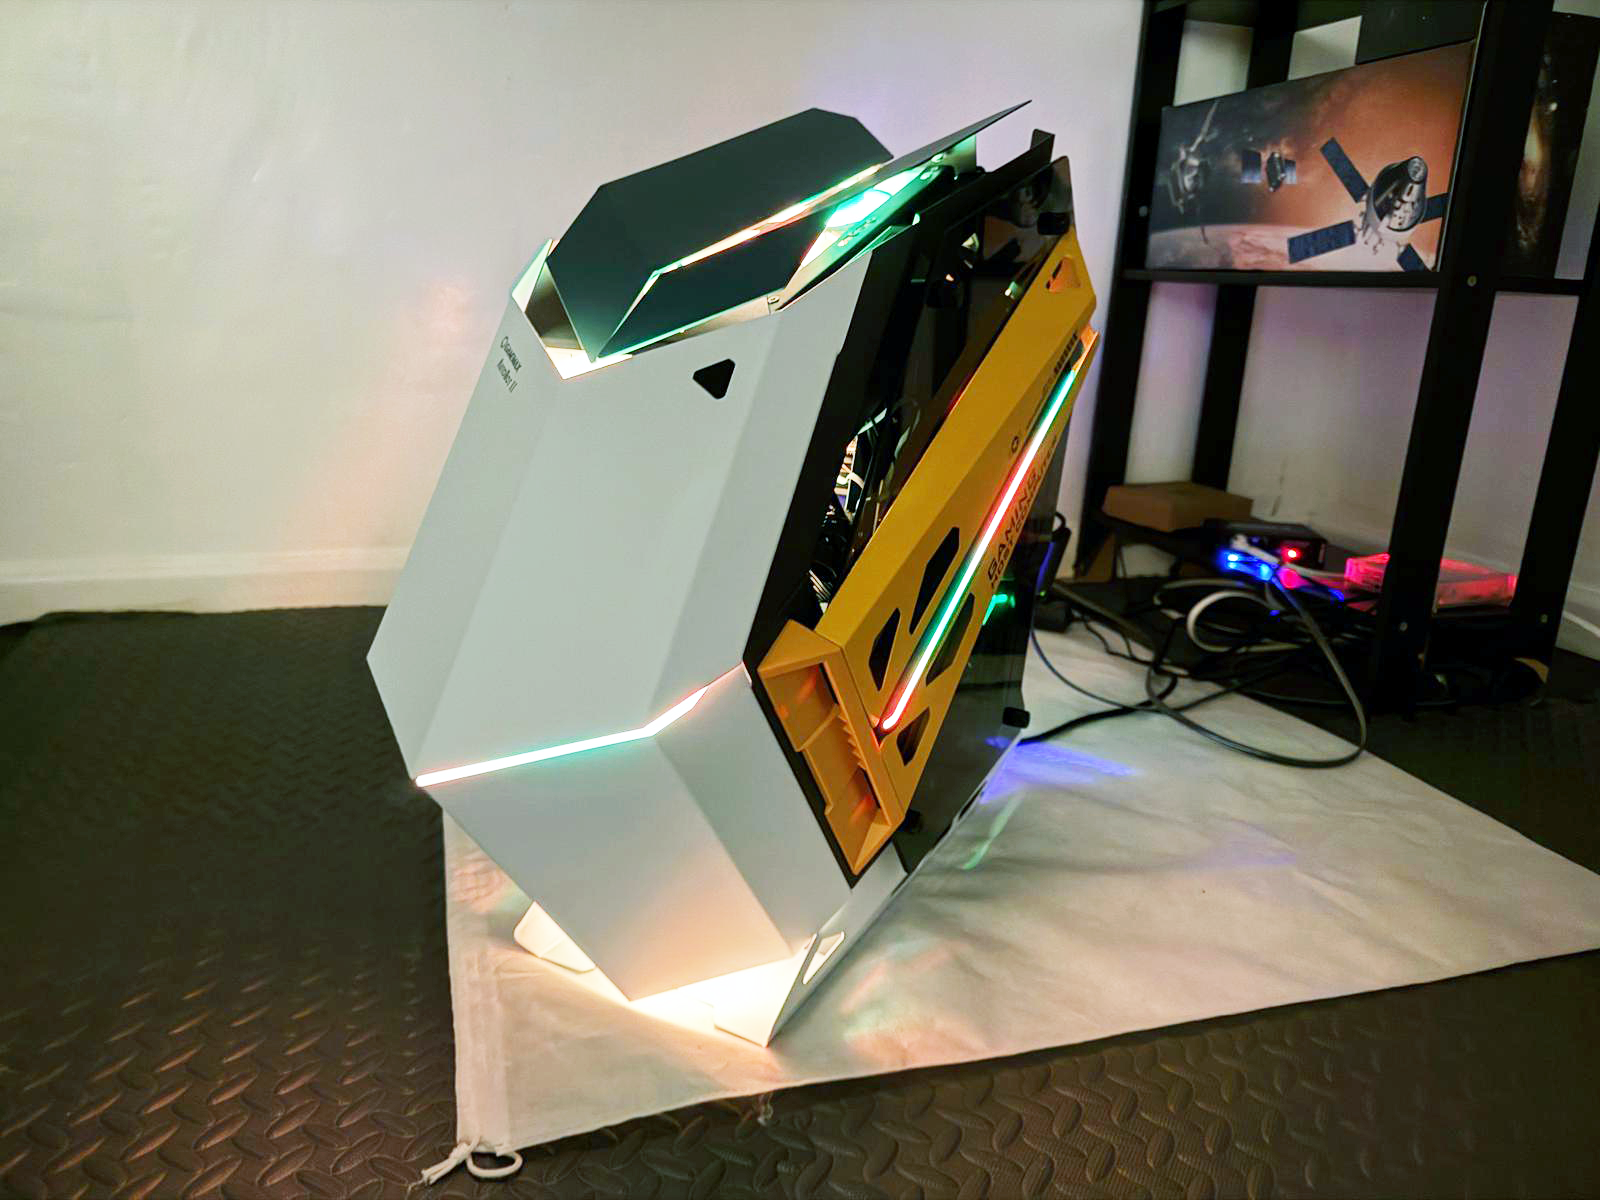
The AI server is engineered from cutting edge components that enable both high performance computing and artificial intelligence. The hardware consists of a AMD EPYC 9004 architecture with 32 cores, 288 GB of DDR5 RAM, and a NVIDIA P100 GPU. Additionally, 3D printed GPU fan cases provide enhanced performance for machine learning and artificial intelligence workloads. The full part list and other details are available on PCPartPicker9.
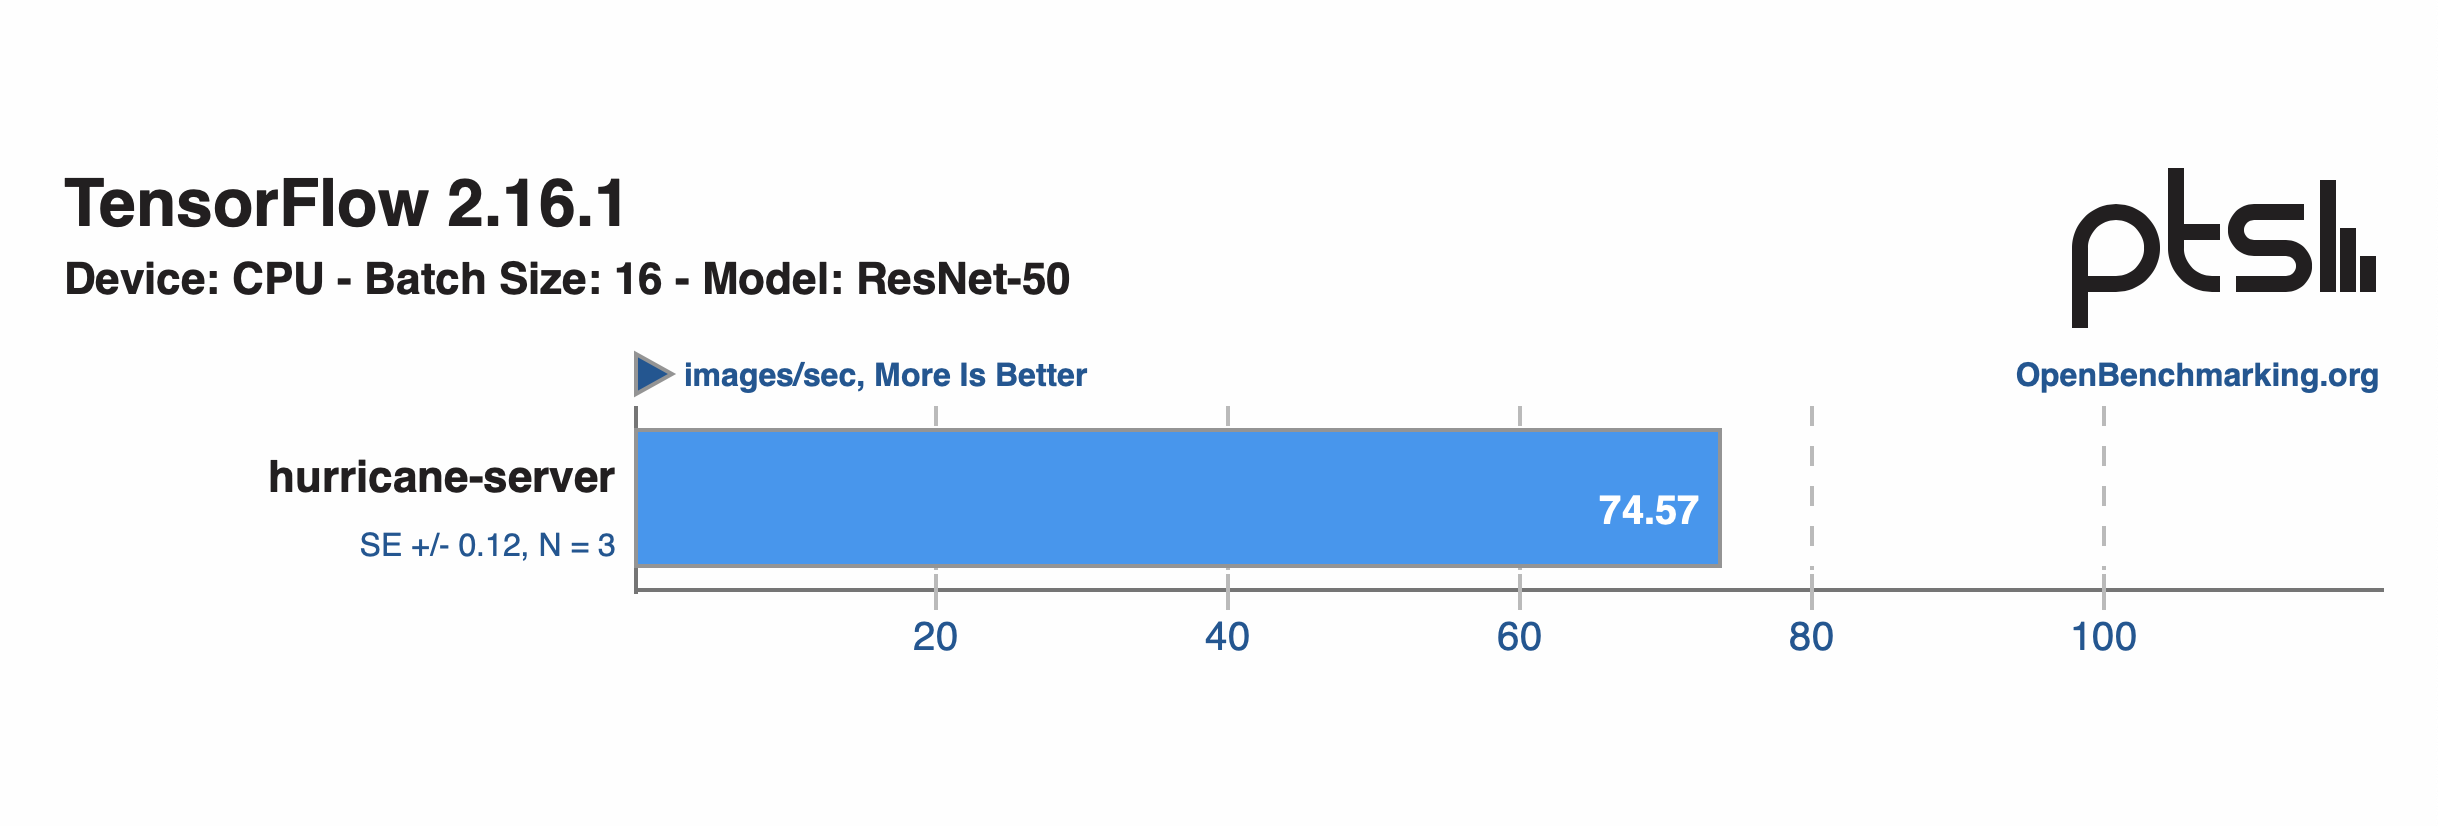
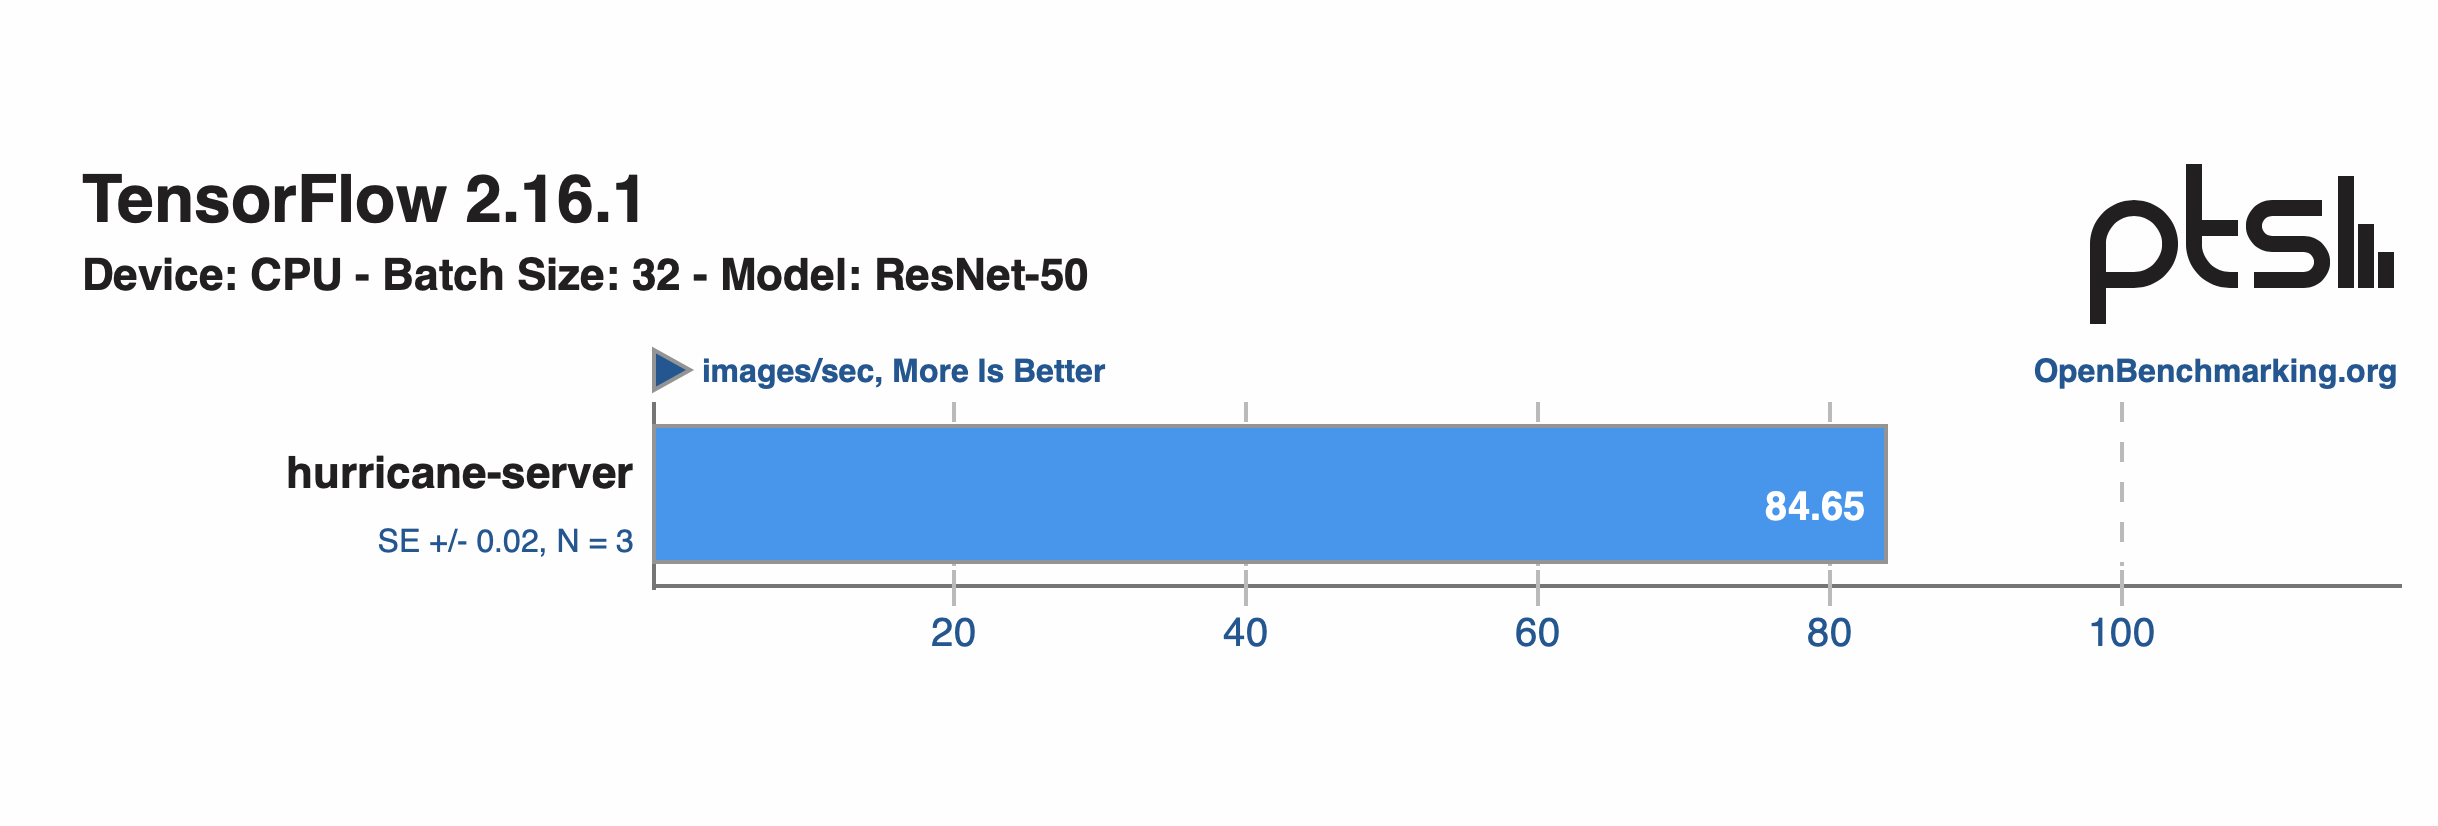
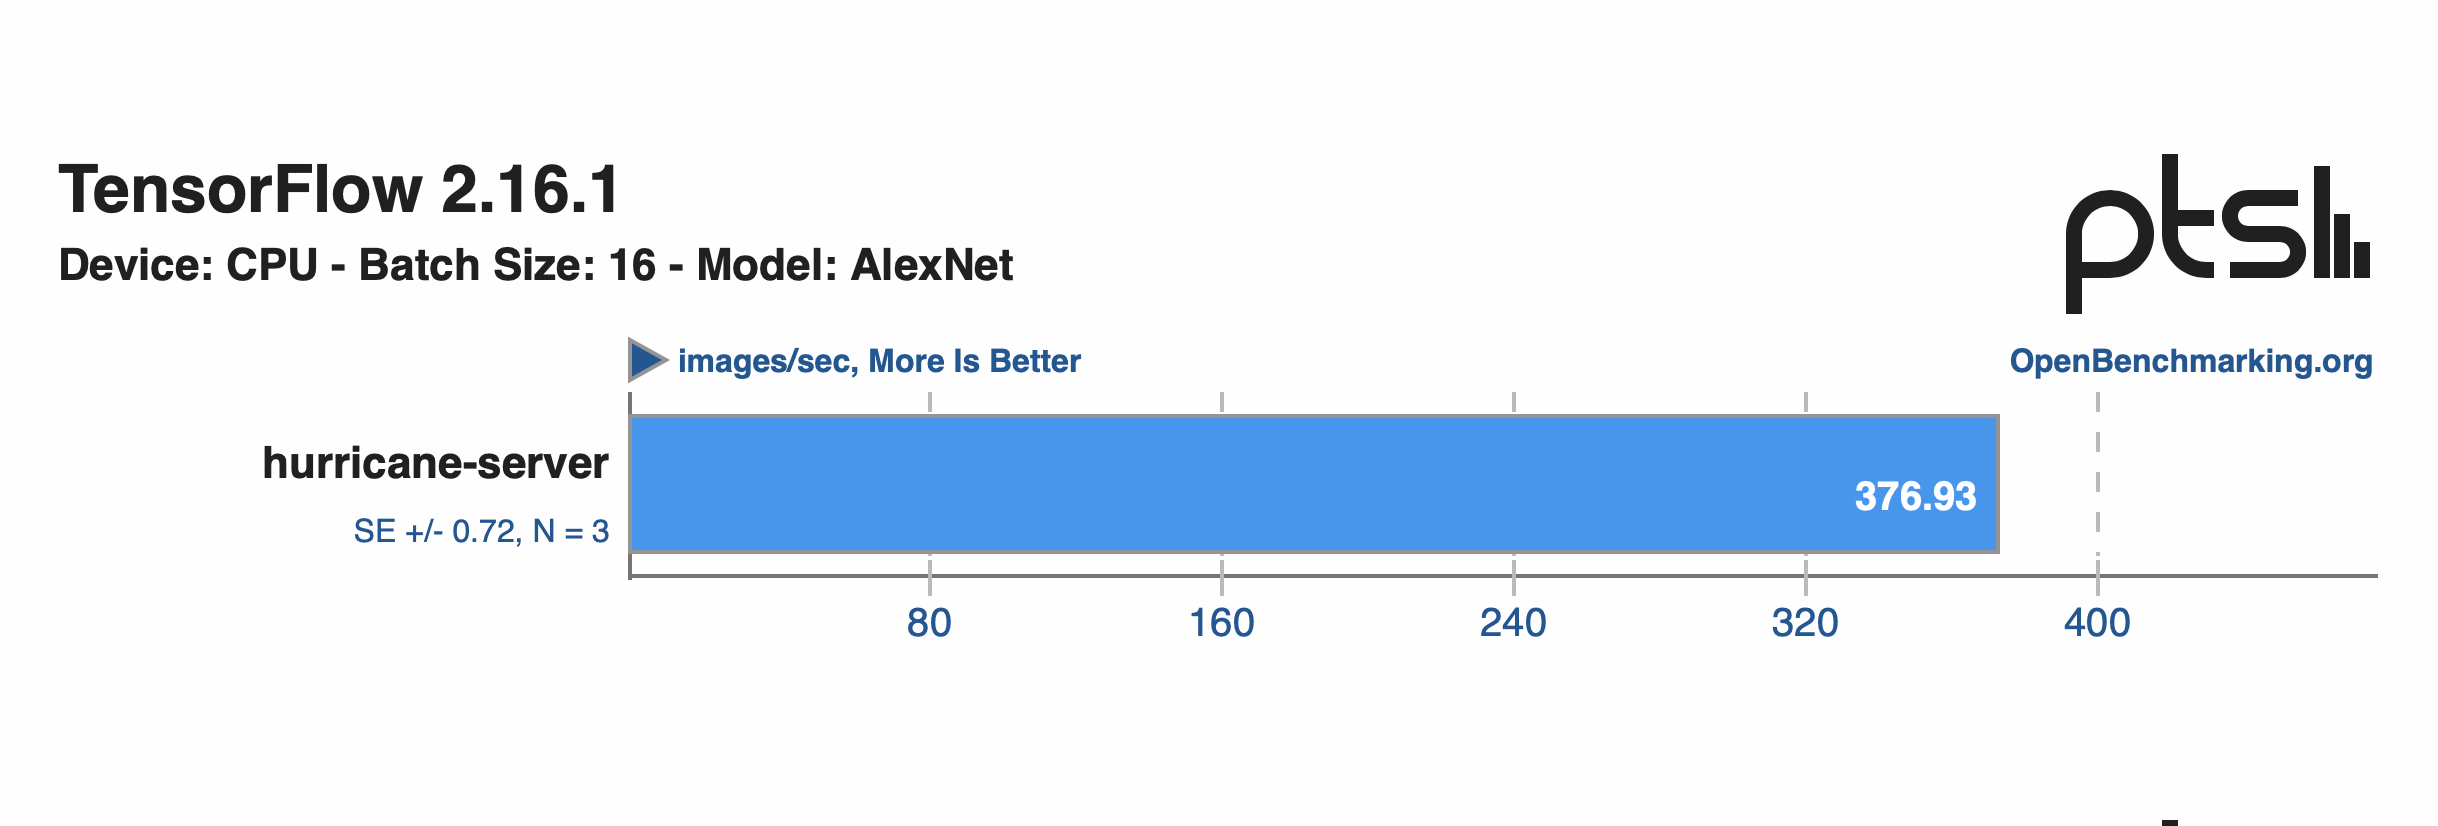
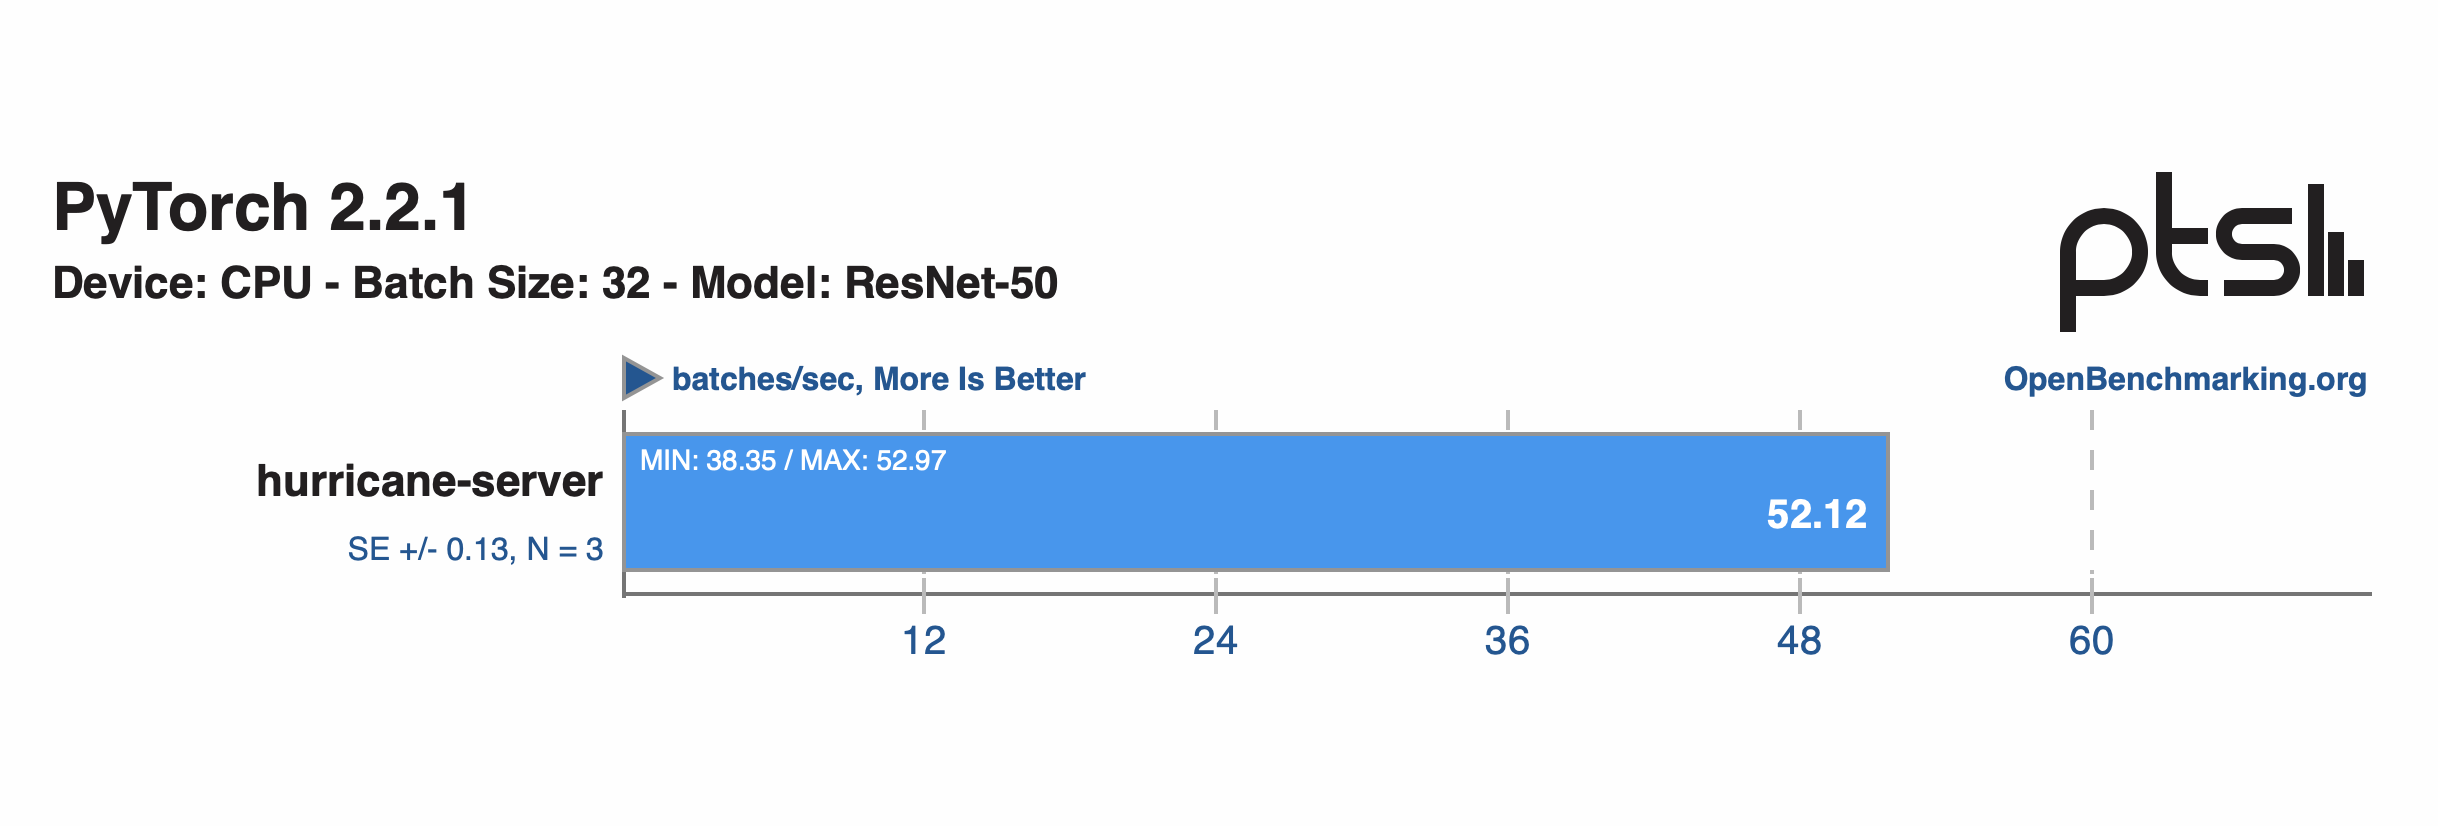
Included are 4 benchmark results that have a better score than the than the publicly listed 100th percentile (1st place) of the “generalized performance for components where there is sufficient statistically significant data based upon user-uploaded results”10. Therefore, we accomplish state-of-the-art results11. Out of the more than 300 benchmarks from the complete Machine Learning Test Suite12, the majority score above the 75th percentile. The full results were uploaded and are publicly available on OpenBenchmarking13.
- https://github.com/hammad93/hurricane-net/blob/main/docs/archive/server_rt_power.csv ↩︎
- https://www.epa.gov/egrid/summary-data ↩︎
- https://github.com/hammad93/hurricane-net/blob/main/docs/carbon_emissions.ipynb ↩︎
- https://www.epa.gov/system/files/documents/2025-06/summary_tables_rev2.pdf ↩︎
- https://ghgprotocol.org/sites/default/files/2022-12/Scope2_ExecSum_Final.pdf ↩︎
- https://circularcomputing.com/news/carbon-footprint-laptop/ ↩︎
- https://www.jmlr.org/papers/volume24/23-0069/23-0069.pdf ↩︎
- https://huggingface.co ↩︎
- https://pcpartpicker.com/b/yHkXsY ↩︎
- https://openbenchmarking.org/test/pts/lczero-1.8.0 ↩︎
- https://www.linkedin.com/posts/hammadus_httpslnkdinerd6ppw-im-excited-to-activity-7275480026022612992-Pcdq/ ↩︎
- https://openbenchmarking.org/suite/pts/machine-learning ↩︎
- https://openbenchmarking.org/result/2412185-NE-HURRICANE76 ↩︎